Volume Profile & POC
Shows net pressure, time spent and traded value at each price level, and marks the level that matters most.
Indicator overview
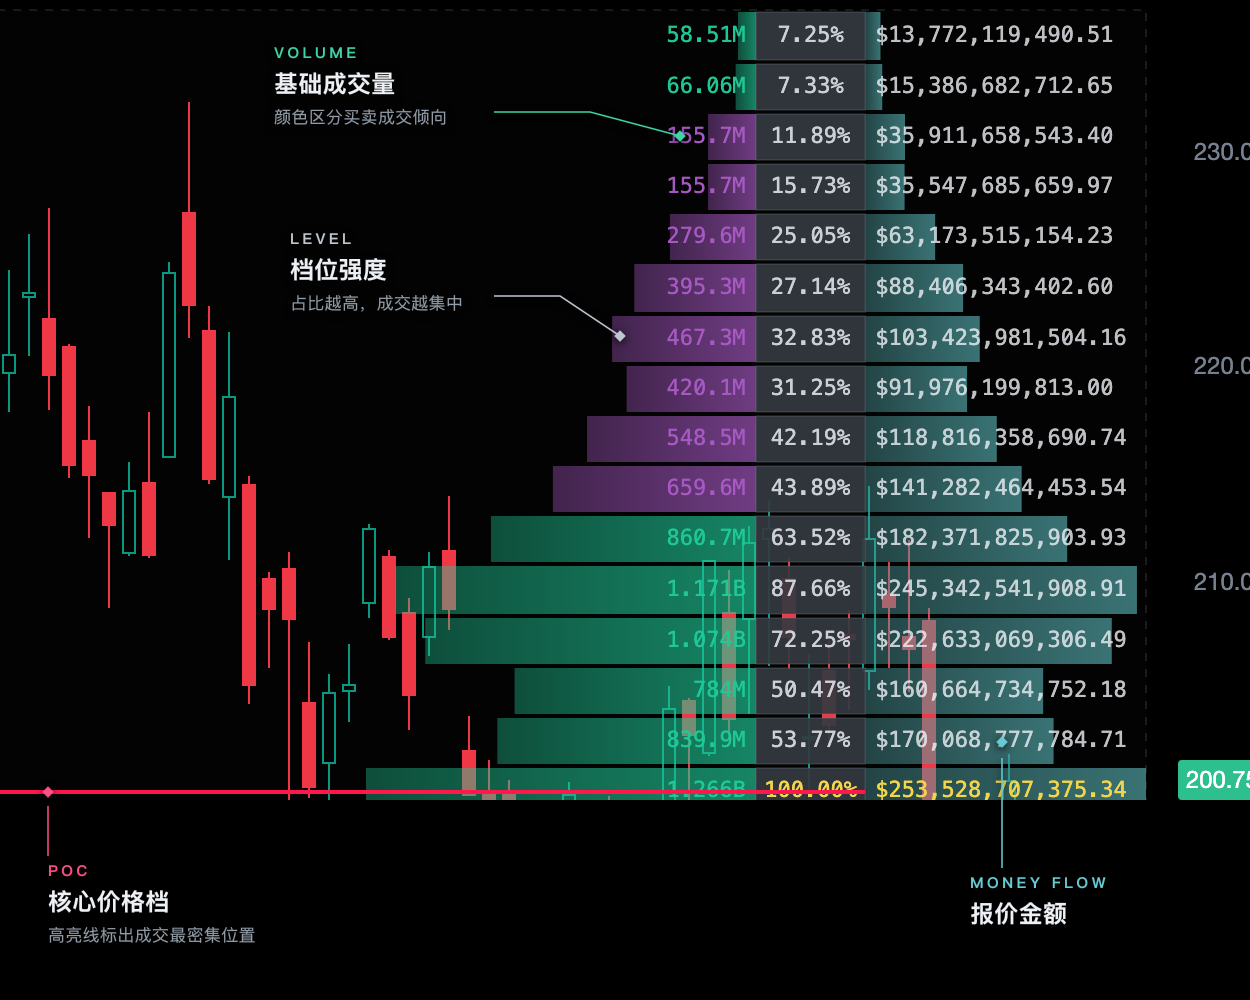
Use it to see where price has been spending its time and where the money has gone over the recent range. Each row is a price band: the left side shows whether buyers or sellers led at that level, the middle shows how long price stayed there, the right shows the value traded, and the amber line marks the longest-held level.
Time spent is the column worth reading first. A high number on the row holding the current price means this band has already been traded through; a low number means price has only just arrived. Every column recalculates when the window changes, so it describes the current stretch of market rather than a permanent level.
How to read the chart
- Green / red bar on the left
- Net pressure at the level — green when buyers led, red when sellers led. A longer bar means a wider imbalance
- Centre percentage cell
- How long price stayed at that level, relative to the longest-held row at 100%
- Teal bar on the right
- Value traded at that level
- Amber POC line and highlighted row
- The level price has held the longest
Signal confirmation
Worked-through area
A high percentage on the current price row — the band has already been traded heavily and price tends to move on
Fresh area
A low percentage on the current price row — price has just arrived and is more likely to range here
One-sided level
Long time spent together with a clearly lopsided net, marking a level that was fought over with a tilt
Blank level
Price passed through with almost no time spent, leaving little to reference
Further viewing
Watch on YouTubeThis video is for feature guidance only. Use the output and parameters shown on this page as the source of truth.
How to use it
- 01
Start with the percentage on the row holding the current price to tell a worked-through area from a fresh one
- 02
Treat the POC and long-held levels as places to watch — wait for a candle reaction and structure confirmation once price arrives
- 03
Read the net colour to understand who led at that level in the past, not as a direction call on its own
- 04
Find the main areas on a higher timeframe, then execute on a lower one alongside structure signals
- 05
Re-read the profile after changing timeframe or window; percentages from different settings are not comparable
Symbols without real volume, a volume definition that changes mid-series, adjustments that desynchronise historical price and volume, and instruments that gap frequently.
Parameter guide
Recent bars included. Too short and the price range narrows until the profile stops being useful
Vertical resolution — 8 for structure, 24 for detail
Picks the key level by time spent; can also pick by volume or by net pressure
Toggles the key level line and its row highlight
Marks the band carrying the bulk of the trading when enabled
For technical-analysis education only, not investment advice. Use independent judgment and risk controls.