Money Flow Tracker
Blend MFI, CMF, and price-to-VWMA deviation into a -100 to 100 money-flow reading.
Indicator overview
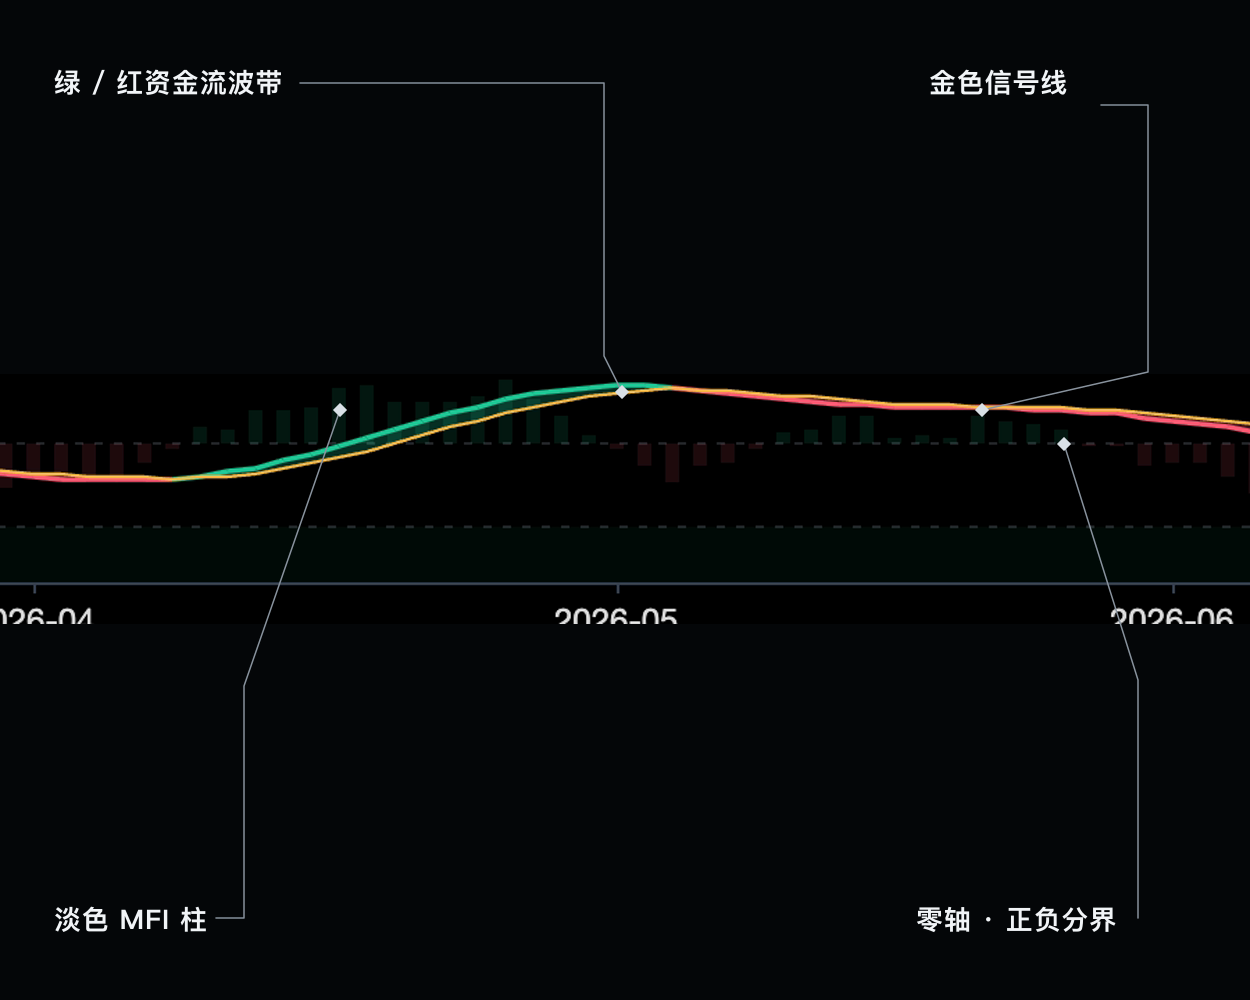
Use this indicator to see which side is gaining buying or selling pressure. Readings above zero favor buyers, while readings below zero favor sellers. A green wave shows flow strengthening, a red wave shows it weakening, and the gold line helps judge whether the change is persisting.
It can confirm whether a rally has volume support and reveal divergence when price keeps rising while flow fades. The reading is estimated from candles and volume rather than exchange order flow, so use it for confirmation instead of claiming exact institutional buying or selling.
How to read the chart
- Green / red flow ribbon
- Green when flow is above its signal and red when below
- Amber signal line
- Smoothed baseline for crosses and acceleration
- Faint MFI columns
- Volume-aware background behind the flow ribbon
- Zero line
- Positive/negative pressure divider, not an OB/OS level
- ±70 zones
- Extreme pressure that may persist or exhaust
Signal confirmation
Flow turns positive
Flow crosses its signal and moves above zero with trend agreement
Flow divergence
Price makes a new extreme while money flow fails to confirm
Further viewing
Watch on YouTubeThis video is for feature guidance only. Use the output and parameters shown on this page as the source of truth.
How to use it
- 01
Favor longs when flow is above zero and above its signal line
- 02
Do not fade an extreme reading until the line actually turns
- 03
Agreement with Volume Matrix provides stronger price-volume confirmation
- 04
Do not use the indicator when real volume is unavailable
Symbols without volume, changing volume definitions, or extremely sparse extended sessions.
Parameter guide
Shorter is faster; longer is steadier
Window for accumulation/distribution pressure
Adaptive T3 response boundaries
For technical-analysis education only, not investment advice. Use independent judgment and risk controls.