Liquidity Zones
Extend liquidity-volume panels from confirmed swings with Bull, Bear and Delta metrics.
Indicator overview
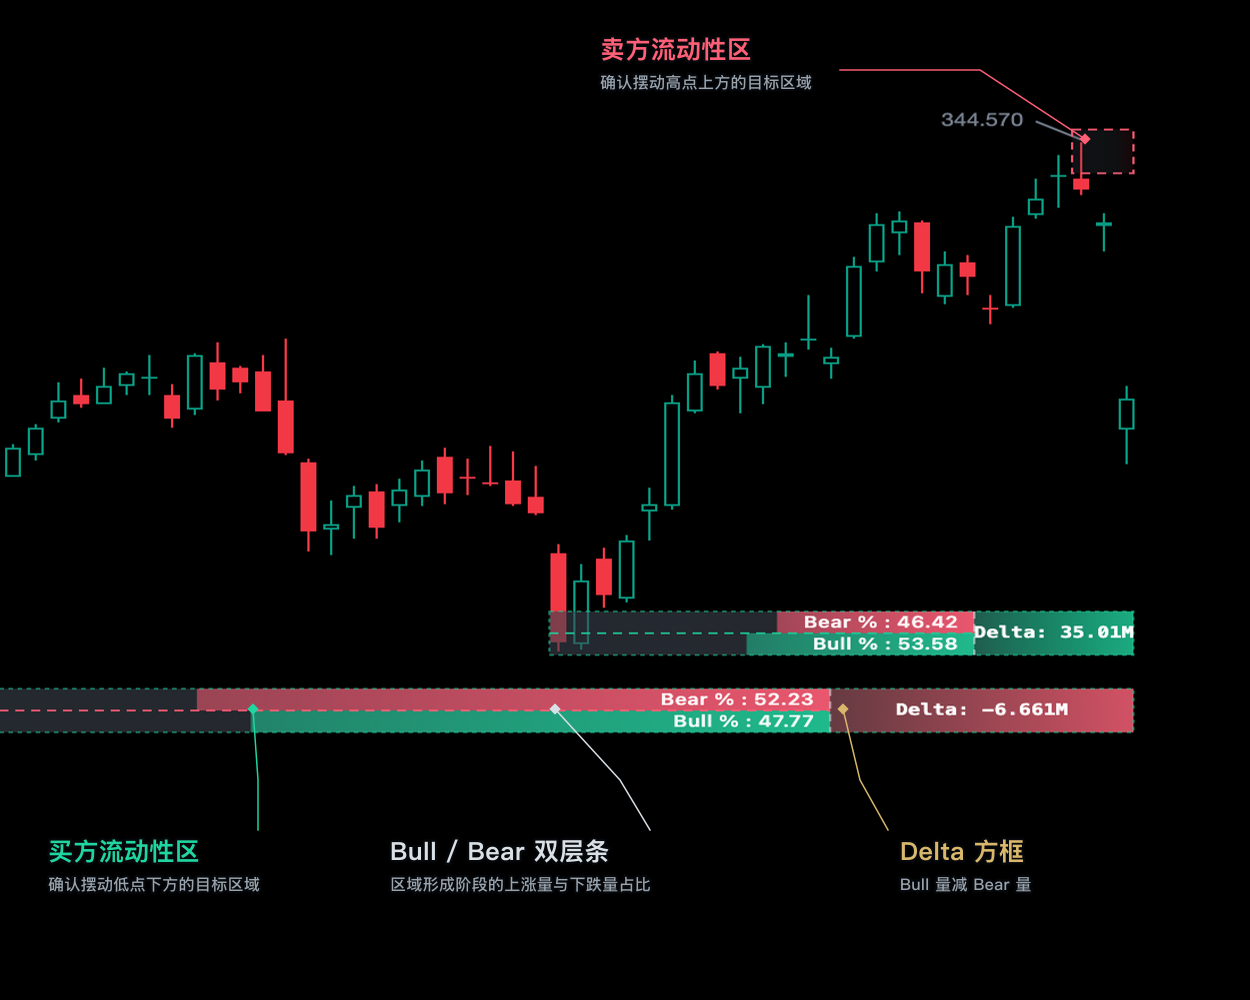
Use Liquidity Zones to mark the most important target areas above and below price. Red zones above often hold sell-side liquidity and can become upside targets or resistance. Green zones below often hold buy-side liquidity and can become downside targets or support.
They are useful for planning profit targets, placing stops beyond obvious clusters, and watching how price reacts on arrival. Bull, Bear, and Delta show which side was stronger while the zone formed, but the zone is only a likely destination or pause area—not a guarantee of reversal.
How to read the chart
- Upper red zone
- Sell-side liquidity formed from a confirmed swing high
- Lower green zone
- Buy-side liquidity formed from a confirmed swing low
- Bull / Bear split bars
- Directional volume shares measured while the zone forms
- Right-side Delta box
- Bull minus Bear volume, green when positive and red when negative
- Dotted midpoint and gray base
- Panel bounds, separation and extension geometry from the reference
Signal confirmation
Sell-side zone
An upper liquidity area that can act as a target, resistance, or stop-liquidity reference
Buy-side zone
A lower liquidity area that can act as a target, support, or stop-liquidity reference
Volume dominance
Bull/Bear shares and Delta show which side dominated during formation
Zone retirement
The panel stops extending when price crosses its outer edge or maximum age is reached
Further viewing
Watch on YouTubeThis video is for feature guidance only. Use the output and parameters shown on this page as the source of truth.
How to use it
- 01
Treat upper sell-side and lower buy-side liquidity as targets first, not automatic reversals
- 02
Delta describes formation dominance; require BOS, CHoCH, or displacement for direction
- 03
Use the far zone edge for invalidation and the next liquidity zone for staged targets
- 04
Evaluate premarket and regular-session volume separately when their microstructure differs
Missing reliable volume, large tick sizes, extremely thin premarket trading, or frequent gaps.
Parameter guide
Bars compared to the left; higher values select larger swings
Explicit confirmation delay that prevents future-data backfill
Minimum volatility-adjusted thickness of each liquidity panel
Maximum bars an unbroken zone can extend rightward
Maximum latest active liquidity zones retained together
For technical-analysis education only, not investment advice. Use independent judgment and risk controls.