Linear Regression / Volume Exhaustion
Capture trend shifts and extreme mean reversion through a standardized regression oscillator with live invalidation levels.
Indicator overview
Use this indicator for two jobs: spotting a change in trend state and finding possible reversion after price becomes stretched. A zero-line cross warns that direction may be changing. An arrow after the oscillator reaches an outer extreme warns that the old move may be running out of energy.
It is useful for reducing exposure, tightening protection, or waiting for reversal confirmation. The Invalidation marker shows where the current idea no longer makes sense; it is not a guaranteed execution price. In a strong trend, treat an extreme arrow as a warning first, not an instruction to reverse immediately.
How to read the chart
- Cyan / blue regression oscillator
- Cyan above zero and blue below, with intensity tied to deviation
- +1.5 / -1.5 threshold lines
- Independent upper and lower boundaries for extreme regression readings
- Diamonds and arrows
- Diamonds mark zero-cross trend changes; arrows mark mean-reversion turns
- Tooltip Invalidation
- Latest-five-bar price reference captured at a zero-cross trend change
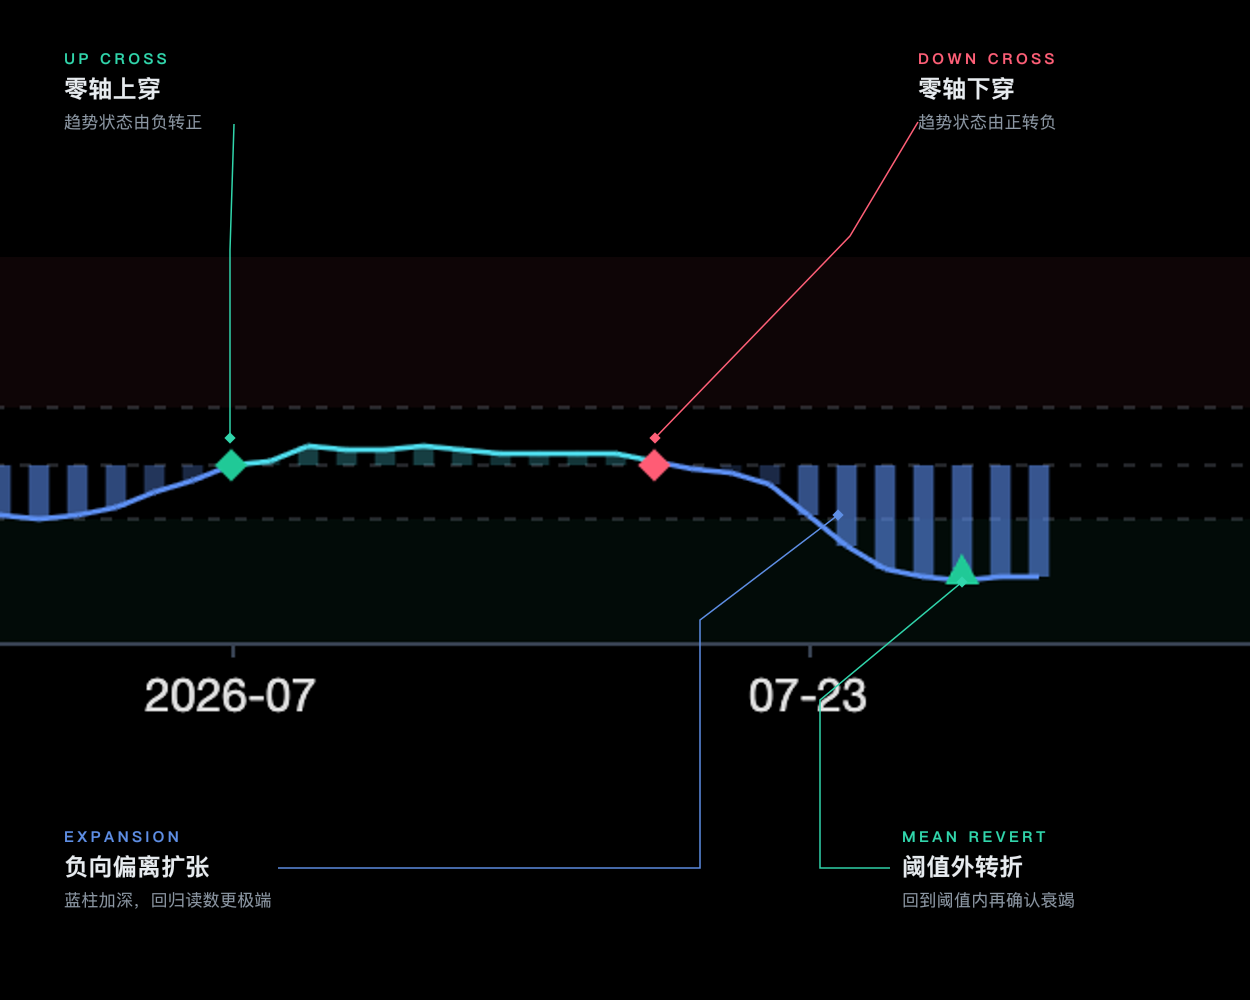
Signal confirmation
Trend change
The oscillator crosses zero at the close and refreshes invalidation
Mean reversion
A two-bar turn confirms while still outside the relevant threshold
Exhaustion confirmation
An extreme reading aligns with abnormal volume and returns inside its threshold
Further viewing
Watch on YouTubeThis video is for feature guidance only. Use the output and parameters shown on this page as the source of truth.
How to use it
- 01
Use zero crosses for trend state and threshold turns for mean reversion; they are separate events
- 02
Treat Invalidation as a state-failure reference, not a guaranteed executable stop price
- 03
In a strong trend, use a countertrend mean-reversion marker as a scale-out warning first
- 04
Manage trend-change and mean-reversion alerts separately instead of applying one execution rule
Earnings, resumptions, adjusted-price discontinuities, acceleration breakouts, and unreliable volume.
Parameter guide
Defines the local trend; longer is slower
Recent sample range used to contextualize extreme readings
Mean-reversion turns must occur beyond the corresponding bound
Bars used to form the state-failure reference
For technical-analysis education only, not investment advice. Use independent judgment and risk controls.