Chan Theory. Made clear.
From structure to signals.

Automatically map fractals, strokes, segments, central zones and three types of buy and sell points on your chart

Paid, invite-only TradingView script — author approval required

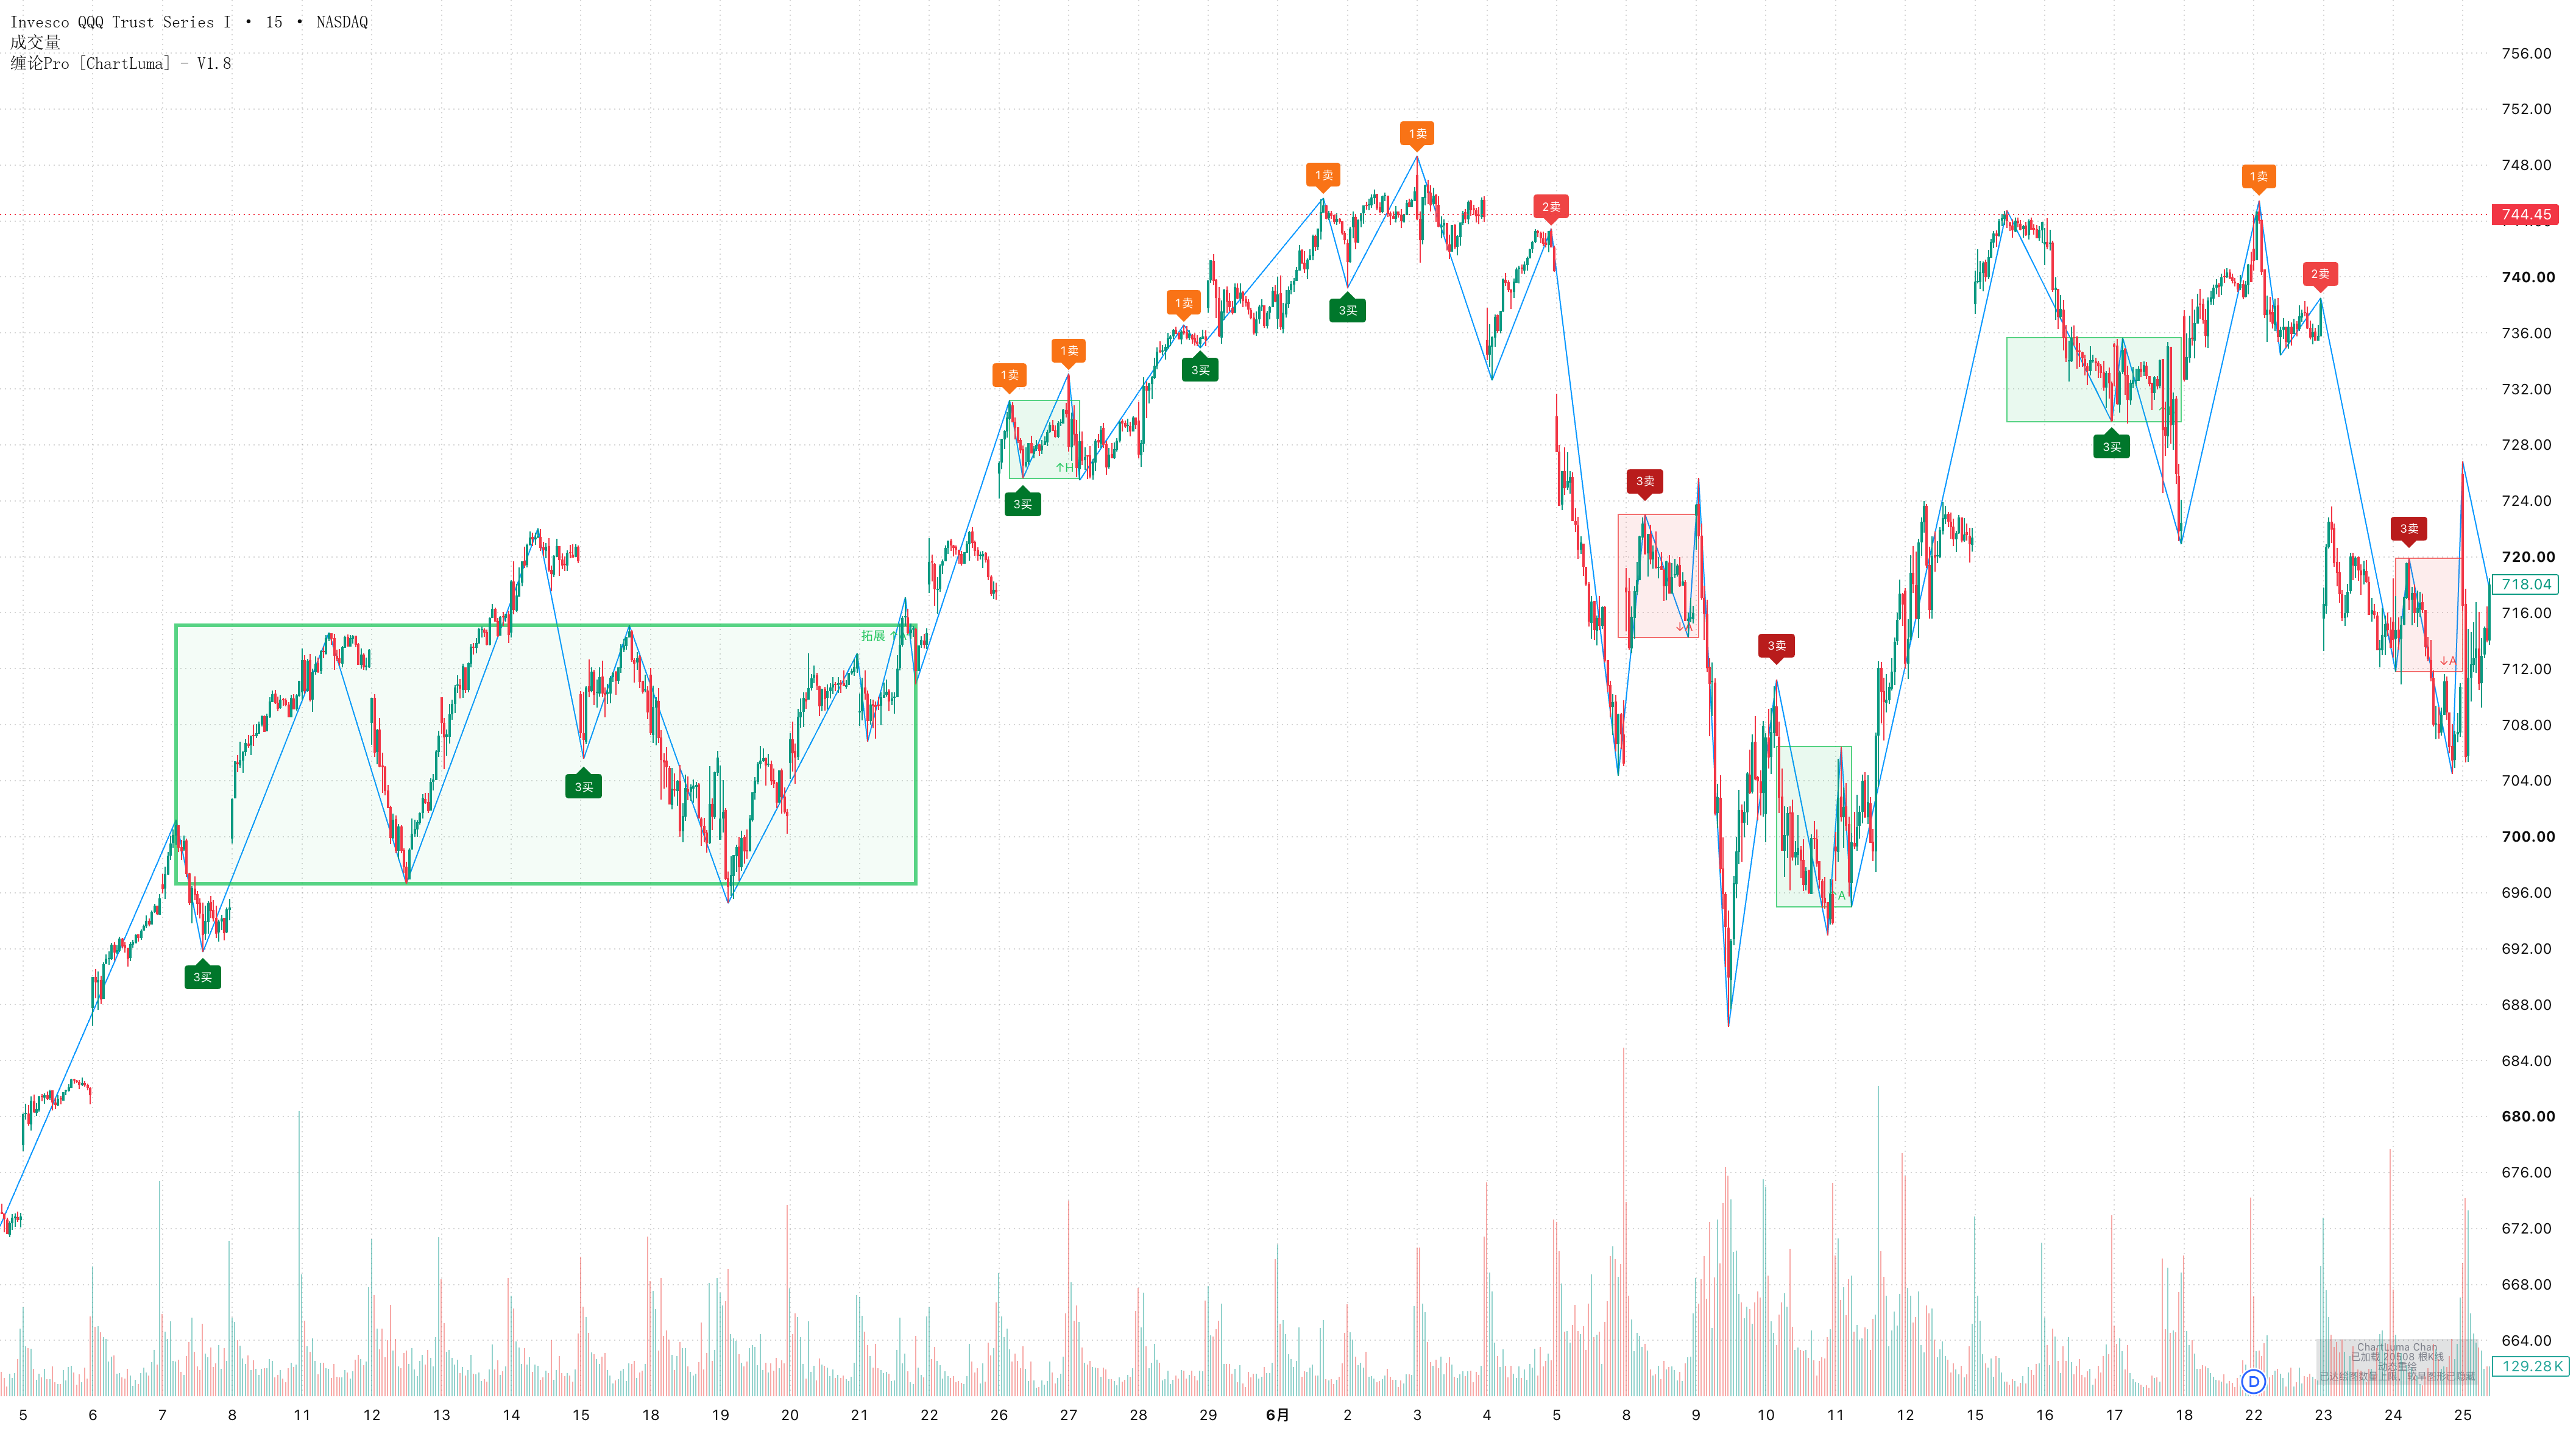
TradingView screenshot of QQQ on the 15-minute chart with Chan Pro strokes, central zones, buy and sell points, volume and original watermark

Recognition parameters

Customize structure settings

  • Adjust raw and merged candle spacing
  • Configure zone extension, upgrades and strict mode
  • Set Type 1 divergence and Type 2 confirmation thresholds
Read the detailed explanation

Structural levels

Strokes and segments together

  • Show strokes and segments independently
  • Inspect stroke and segment central zones
  • Choose signals at either structural level
Read the detailed explanation
StrokesSegments
Illustration for explaining features only
Strokes only
Type 3 buy
Add zones and buy/sell points

Illustration for explaining features only

Display and settings

Customize chart display

  • Toggle fractals, strokes, segments and zones
  • Choose Type 1, 2 and 3 buys and sells separately
  • Adjust line widths, dashes and label fills
Read the detailed explanation

Reading buy and sell points

Every signal has a structural context

A turn, a retest, a continuation — know what each point represents

Type 1 points
Type 1 buyType 1 sell
Type 1 buy

A potential turn after divergence

Observe potential divergence-related turns as the preceding move loses strength

Watch for trend exhaustion and turns
Type 2 points
Type 2 buyType 2 sell
Type 1 buyType 2 buy

A retest above the prior low

After a Type 1 buy, watch whether a pullback holds above the prior low to confirm the developing structure

Watch for confirmation after a turn
Type 3 points
Type 3 buyType 3 sell
Type 3 buy

A retest outside the zone

After price leaves a zone to the upside, watch whether the retest low remains above its upper boundary

Watch for continuation beyond the zone

Buy-side illustrations; sell points are mirrored. Dashed paths illustrate direction, not a forecast

Full feature overview

From recognition to presentation

These features and settings describe ChartLuma; TradingView options depend on the current script version

Candle inclusion and gaps

Process inclusion relationships, with initial direction, price-gap handling and gap timeframe threshold settings

Fractals and strokes

Toggle top and bottom fractals and strokes separately; adjust minimum raw-candle and merged-candle spacing

Segment recognition

Configure characteristic-sequence inclusion and strict stroke-break mode to study segment-level structure

Central zones and expansion

Show stroke and segment zones; set the large-zone threshold, extension, upgrades and strict mode

Six buy and sell labels

Toggle Type 1, 2 and 3 buys and sells separately, with independent stroke-level and segment-level signals

Signal parameters

Set strict signal mode, Type 1 divergence threshold, Type 2 confirmation offset and small/large zone exit windows

Colors and lines

Customize fractal, stroke, segment and zone colors, line width, solid or dashed lines, and rising/falling zone colors

Labels and preferences

Choose filled, unfilled or outlined signal labels; save your preferences or restore the defaults
Get started

Chan Theory, on your preferred chart

TradingView

Recommended

Add Chan Pro to your TradingView charts and keep your familiar charting environment

  1. Open the Chan Pro [ChartLuma] script page
  2. Message ChartLuma on TradingView with your username and chosen plan
  3. Follow the author’s activation instructions and use the script once access is granted

See the script page for current plans, prices and access periods

ChartLuma

Open Chan Theory on ChartLuma and analyze it alongside your existing chart tools

  1. Sign in or create a ChartLuma account
  2. Open a chart with Chan Theory enabled
  3. Choose a timeframe and customize structure and signal display

Use ChartLuma charts on a computer. Features depend on membership; segments, segment zones and segment signals require the applicable annual access

Before you get started

Are stroke and segment levels different timeframes?

No. Strokes and segments are different structural levels within one chart timeframe. Switching from minutes to hours or days changes the timeframe, which is a separate concept

Can I hide individual chart elements?

On ChartLuma, toggle fractals, strokes, segments, zones and signal types separately, and customize colors and lines. TradingView settings depend on the current script version

Was a historical signal visible at the bar it marks?

Not necessarily. A structure can be confirmed later than the bar where its label is drawn, and developing structures can change. Review signals using the information available at the time

Can I use the TradingView script for free?

Chan Pro [ChartLuma] is a paid, invite-only script. Contact the author and follow the script page instructions to obtain access; adding it to favorites does not grant access

Does ChartLuma membership include TradingView access?

ChartLuma membership and TradingView script access have separate activation instructions. Check your chosen plan and the author’s terms for any cross-platform entitlement

Will both platforms show identical signals?

Both display core Chan Theory structures, but feeds, timeframes, settings and versions may differ. Refer to each platform for its actual signals and available settings

Should I trade immediately when a label appears?

Labels help explain structure; they do not guarantee reversals or profits. Consider the higher timeframe, confirmation state and your own risk controls

Make Chan Theory part of your chart

From fractals to signals, follow each structural change in your preferred charting environment