Institutional-Grade Indicator Strategies
Clear signals for sharper trading decisions
- 100K+
- Active Users
- 15+
- Trading Tools
- 4.6★
- Avg. Rating
- Full-day
- Pre · Regular · After

Turn complex markets into clear signals
Spot trends, key levels, and market shifts earlier
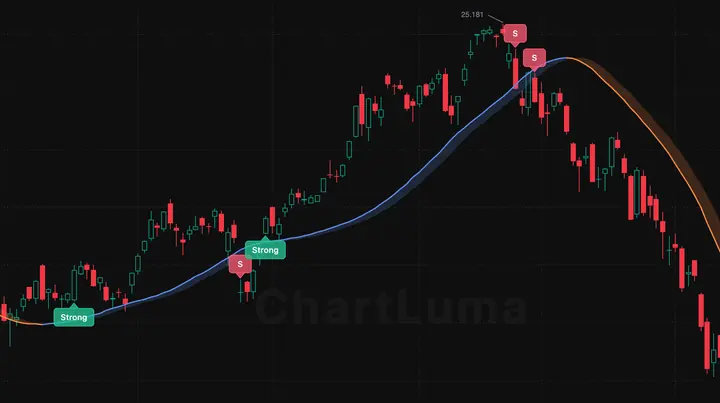
Trend Signals
The indicator adjusts as price moves and uses clear bullish and bearish shift markers to show whether the market currently looks stronger or weaker
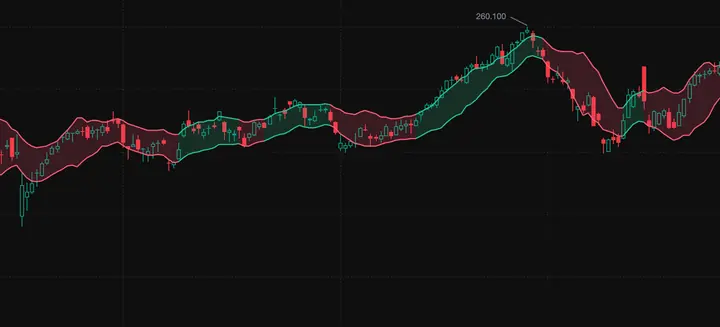
Dynamic Trend Channel
Different colors show the current market direction, while the channel width tells you whether price swings are growing or calming down
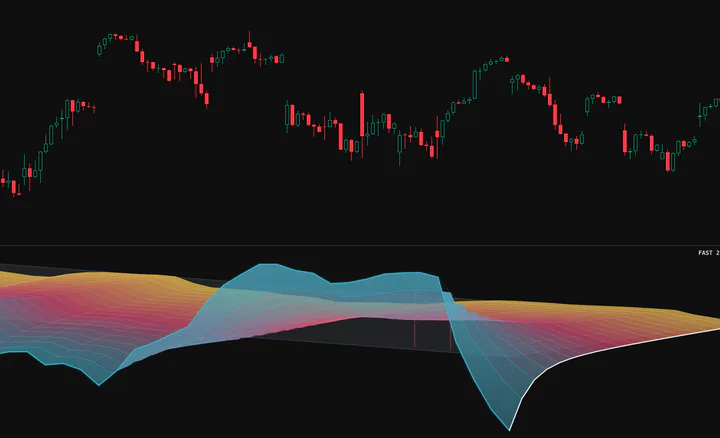
Multi-Horizon Momentum Terrain
Maps multiple momentum horizons into a 3D terrain so you can quickly see when short- and medium-term momentum rise together, weaken together, or diverge
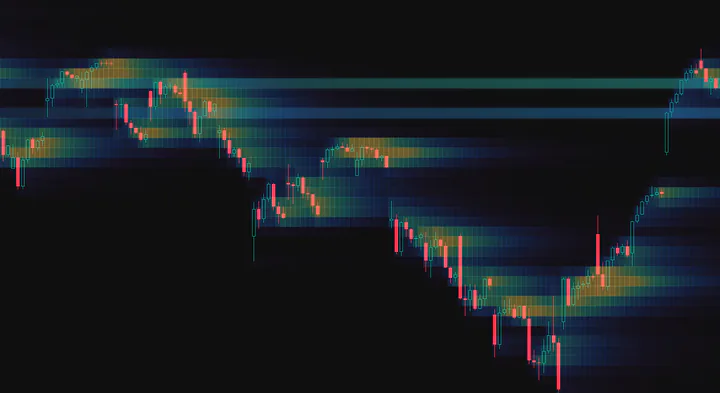
Liquidity Heatmap
Maps trading attention across price and time to reveal heat that is strengthening, fading, or repeatedly concentrating around contested levels
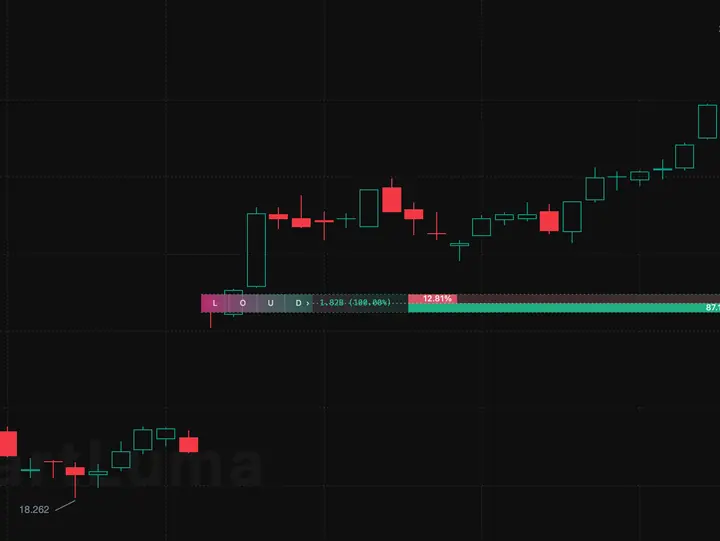
Order Blocks
Important price areas stay marked on the chart so you can see whether price finds support or meets selling pressure when it returns
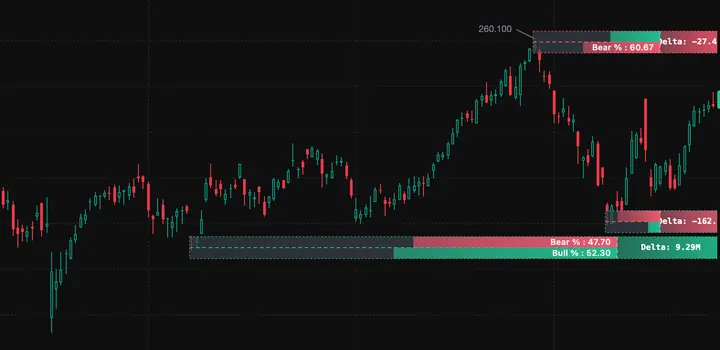
Liquidity Zones
Compare buyer and seller strength inside an important price area instead of guessing where support or resistance might be
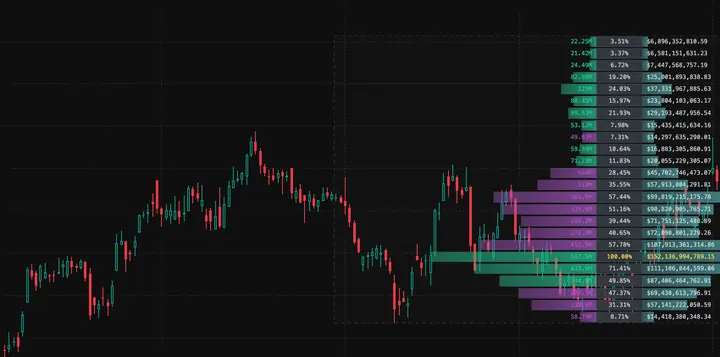
Volume Profile
See where trading activity is concentrated to estimate the prices most investors paid and the areas the market cares about
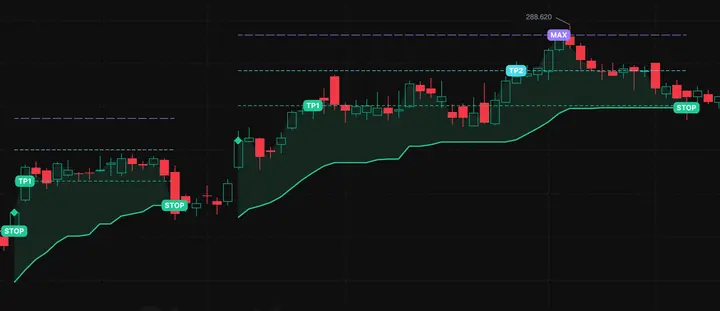
Momentum Trailing Targets
After you enter a trade, the chart shows a stop and several profit targets. As price moves in your favor, the stop follows to help protect gains
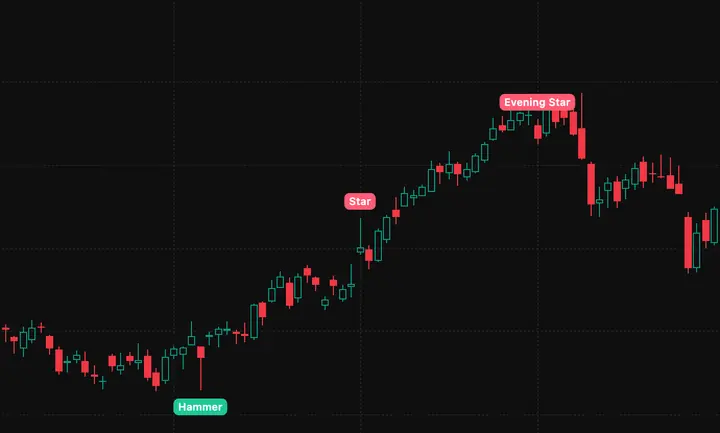
Candlestick Patterns
Common candle changes are recognized and labeled directly on the chart so you can notice possible reversals or continued moves sooner
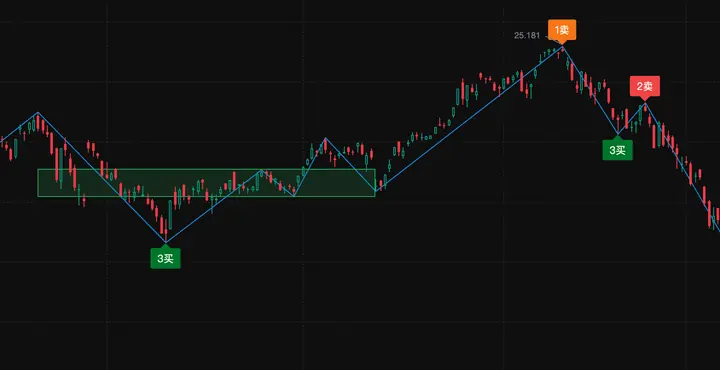
Chan Structure
Important highs and lows are connected automatically, with trading ranges and possible buy or sell areas marked on the chart
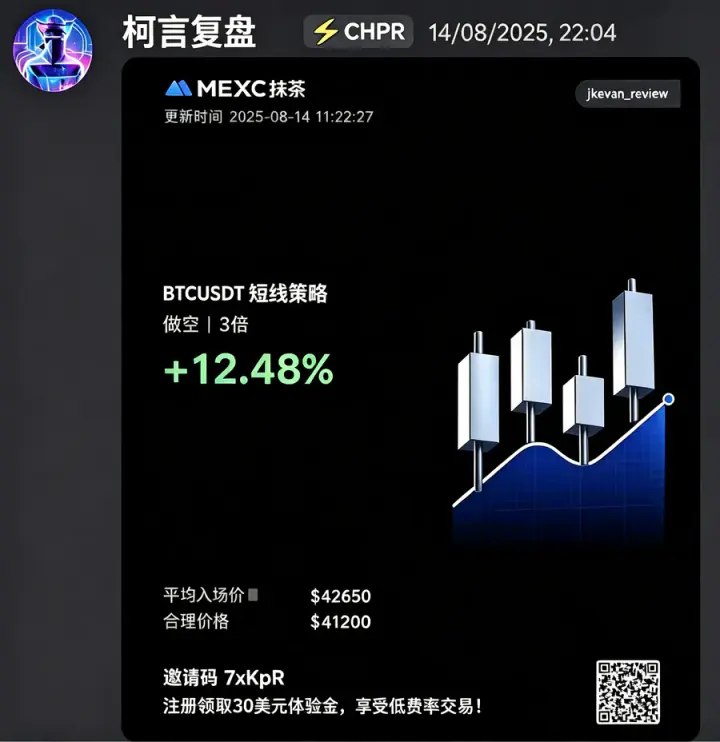
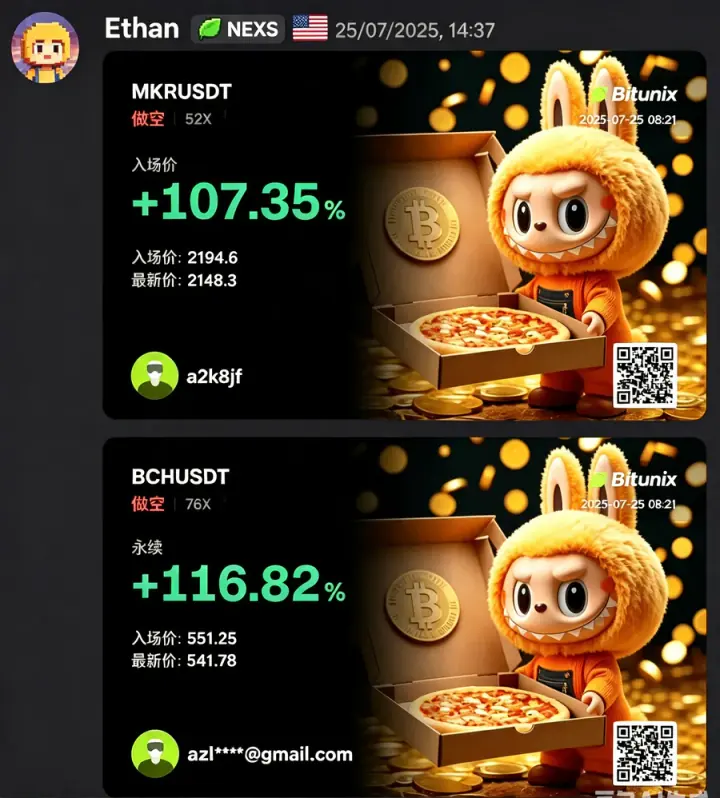
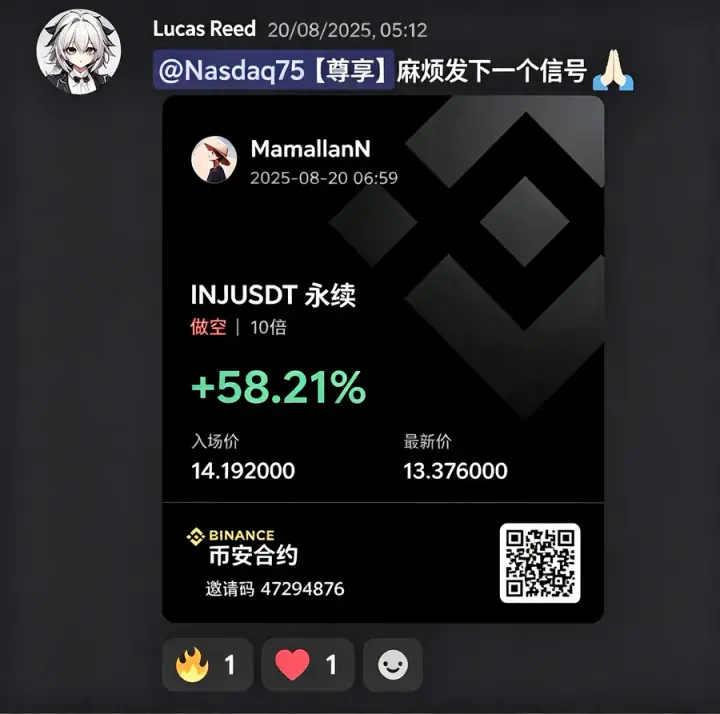
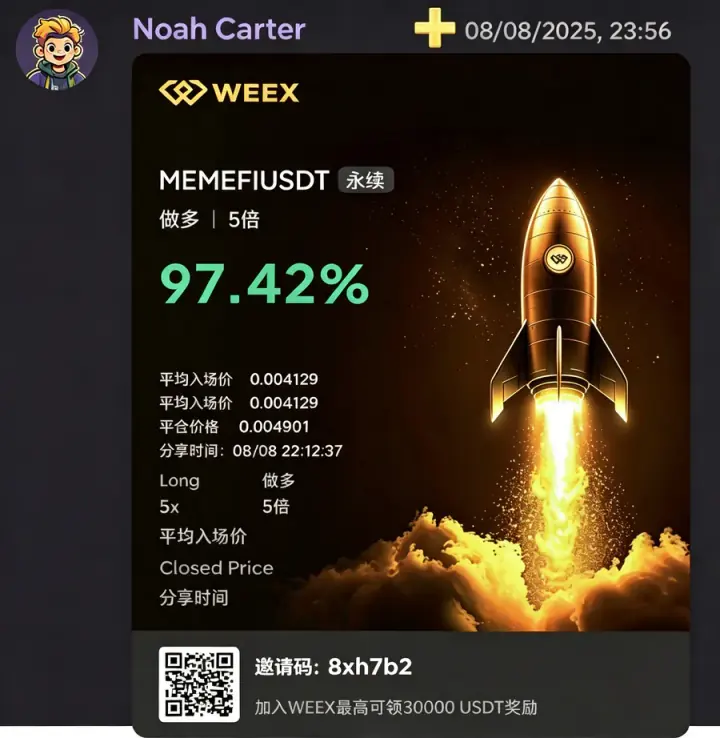
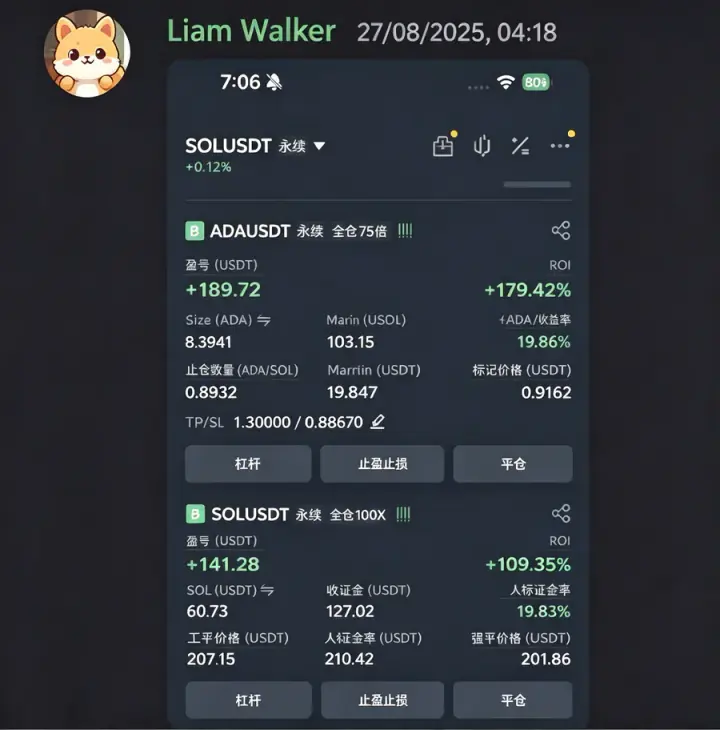
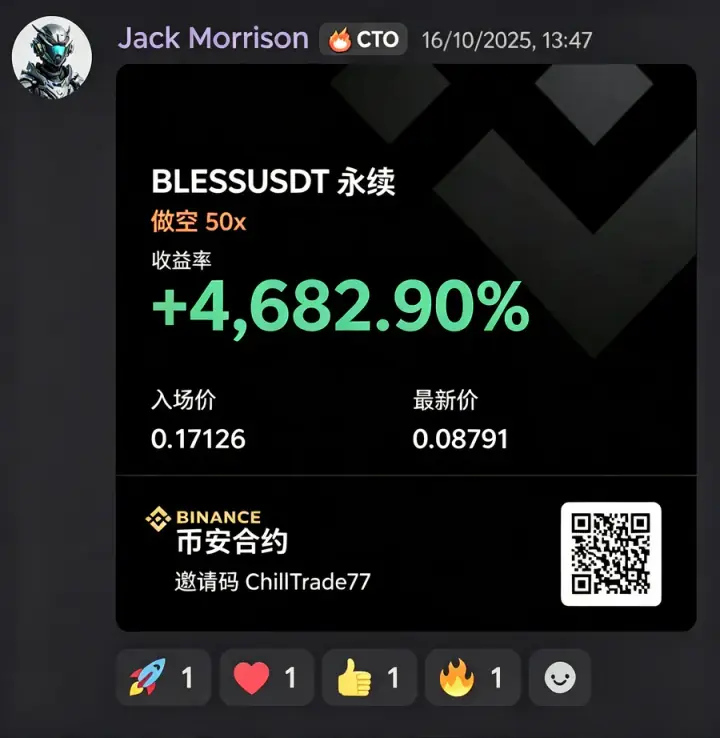
Trader Results
Membership
Clear signals for sharper trading decisions
View plansFAQ