Trend Signals
Detect low-lag direction shifts, then manage them with causal optimization and three take-profit tiers.
Indicator overview
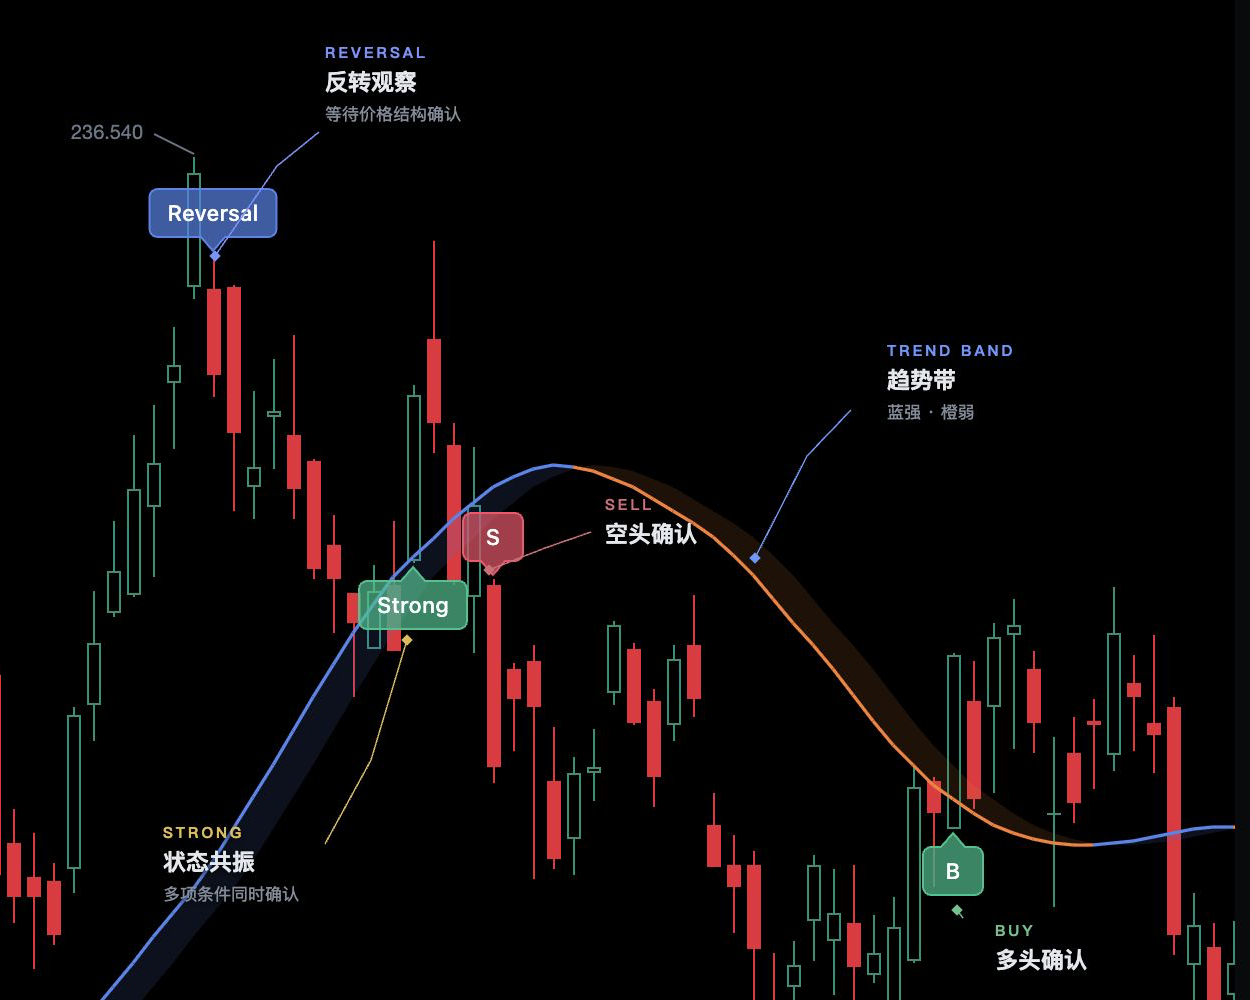
Use this indicator to decide whether the market currently favors trend-following longs, trend-following shorts, or patience. A blue trend band points to strength, an orange band points to weakness, Bullish Shift / Bearish Shift labels flag direction, and Strong Bullish / Strong Bearish labels show that more conditions support the move.
V2 uses a causal recursive low-pass with phase compensation and derives signals from price displacement and trend efficiency, so volume is not required. Manual tuning defaults to 20. Auto Optimizer selects a fast, moderate, or slow response by PNL or win rate using only up to 500 already-closed bars. V1 preserves the historical T3, Reactor, and seven-state combination so saved charts are not silently recalculated. Purple checks, red checks, and MP mark average, above-average, and maximum-profit prompts. Solid labels are confirmed after the close; outlined labels preview the open candle.
How to read the chart
- Internal trend line / volatility bands
- V1 only; V2 follows the public signal view and does not plot its internal filter
- Bullish Shift / Bearish Shift label
- Standard trend prompt after the low-lag direction remains confirmed
- Strong Bullish / Strong Bearish label
- V2 strength combines trend efficiency, line separation, displacement, and ADX; it is not a guarantee
- Reversal label
- Standalone reversal mode uses green for bullish and red for bearish; combined mode uses blue for both
- Purple check / red check / MP
- Average, above-average, and maximum-profit prompts after a confirmed trend signal
- Outlined label
- Open-bar preview that may change before the candle closes
Signal confirmation
Trend confirmation
The low-lag direction agrees for two consecutive bars; V2 adds no hidden cooldown
Reversal prompt
Price re-enters an adaptive volatility band while the low-lag line starts turning the same way
Take-profit prompt
Confirmed progressively from favorable displacement, price extension, and giveback after a trend entry
Further viewing
Watch on YouTubeThis video is for feature guidance only. Use the output and parameters shown on this page as the source of truth.
How to use it
- 01
Confirm the higher-timeframe direction first, then wait for a matching lower-timeframe label
- 02
Prefer bullish shifts above a green Reactor and bearish shifts below a red Reactor
- 03
Pair reversal labels with support/resistance, divergence, or volume exhaustion
- 04
Place risk beyond the signal structure or trailing stop; a label is not a stop-loss plan
Very tight ranges, news shocks, and illiquid symbols where repeated crossings are common.
Parameter guide
V2 is the low-lag price engine; V1 preserves the historical combined model
Show trend, reversal, or both; beginners should start with trend only
V2 manual response; lower reacts faster and usually produces more direction changes
Uses only closed historical bars to select a response without rewriting earlier candles
Fast favors shorter responses, Slow favors longer responses, and Moderate spans both
Rank candidate responses by rolling directional PNL or win rate
V1 only; V2 spacing follows the engine and optimized response
V1 only; V2 keeps Strong classification internal
V1 only; V2 follows the public signal view and does not expose its internal line
V1 only; this does not change V2 reversal calculations
Controls shift, strong, and reversal labels together without changing signal calculations
Shows purple/red checks and MP without changing trend entries
For technical-analysis education only, not investment advice. Use independent judgment and risk controls.