Composite Momentum Reversal
Use multi-scale filter voting for trend strength and confirmed pivot divergence near extremes.
Indicator overview
Use this indicator to see whether a move is accelerating, slowing, or preparing to reverse. A blue wave shows stronger momentum and a purple wave shows weaker momentum. Moving farther from zero means the current direction has more force; returning toward zero means the two sides are becoming more balanced.
It is useful for confirming whether a trend still has energy and for watching extreme pullbacks, signal-line crosses, and divergence. An extreme reading is not an automatic reversal. The useful moment comes when momentum actually turns and price structure confirms it.
How to read the chart
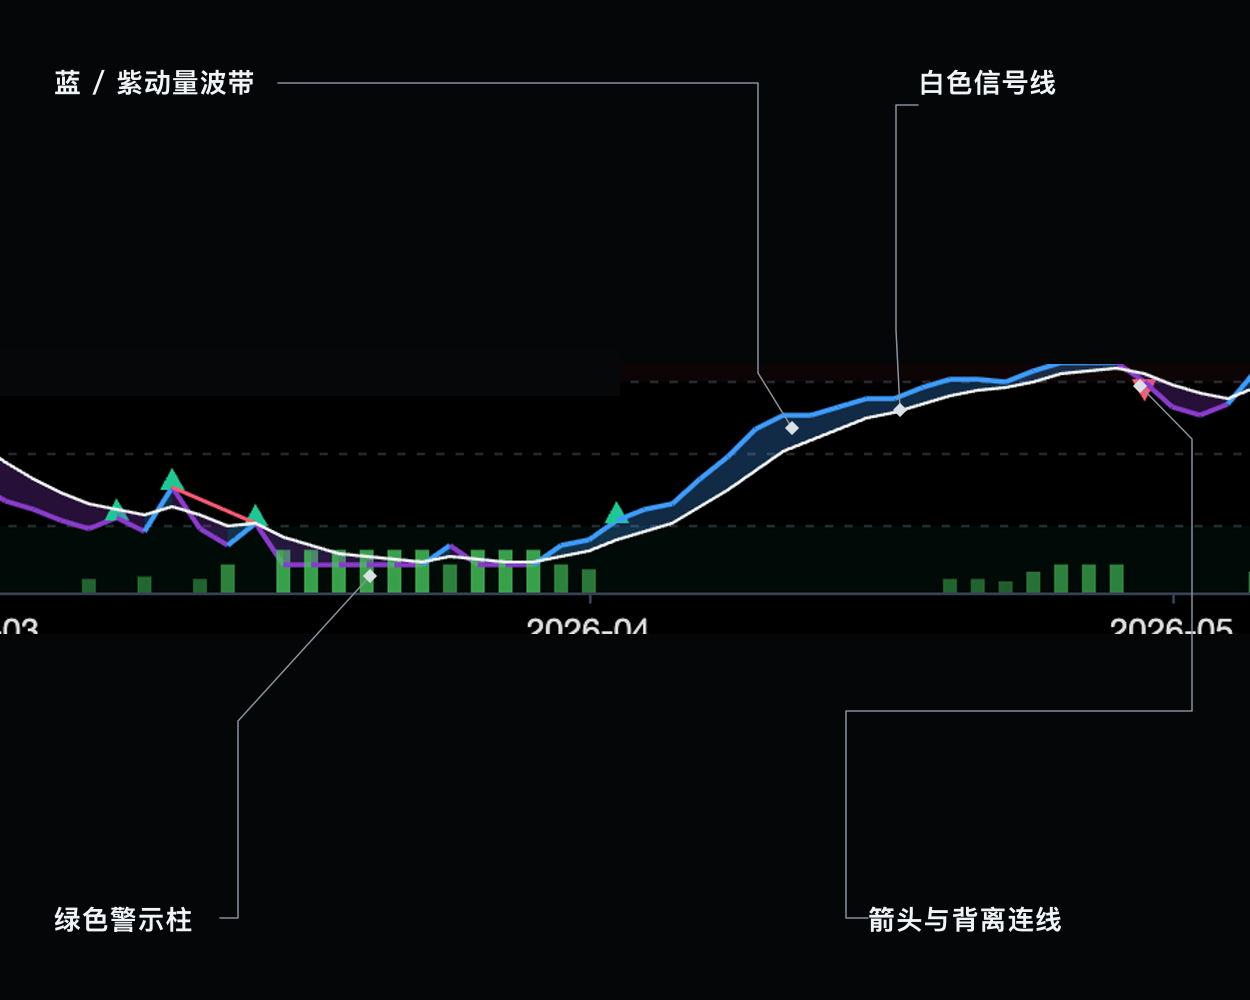
- Blue / purple momentum ribbon
- Blue above the signal and purple below it
- White signal line
- Slower momentum baseline used for transition crosses
- Green warning columns
- Show overextension after momentum enters an extreme zone
- Arrows and divergence lines
- Extreme re-entry arrows and right-confirmed pivot connectors
Signal confirmation
Trend momentum
The line stays on one side of zero and expands further
Reversal setup
An extreme turns, crosses the signal, and price diverges
Further viewing
Watch on YouTubeThis video is for feature guidance only. Use the output and parameters shown on this page as the source of truth.
How to use it
- 01
For trend trades, read zero direction and expansion rather than one cross
- 02
For counter-trend trades, require at least two of extreme exit, cross, and divergence
- 03
Divergence means weakening, not an immediate guaranteed reversal
- 04
A zero-line pullback with Trend Assistant agreement can flag trend resumption
Blindly fading overbought/oversold readings in a powerful one-way trend.
Parameter guide
More is steadier and heavier; fewer is faster
Raise it to make reversal zones less frequent
Controls divergence significance and delay
For technical-analysis education only, not investment advice. Use independent judgment and risk controls.