Long/Short Volume Matrix
Estimate buy/sell volume from close location and track which side remains in control.
Indicator overview
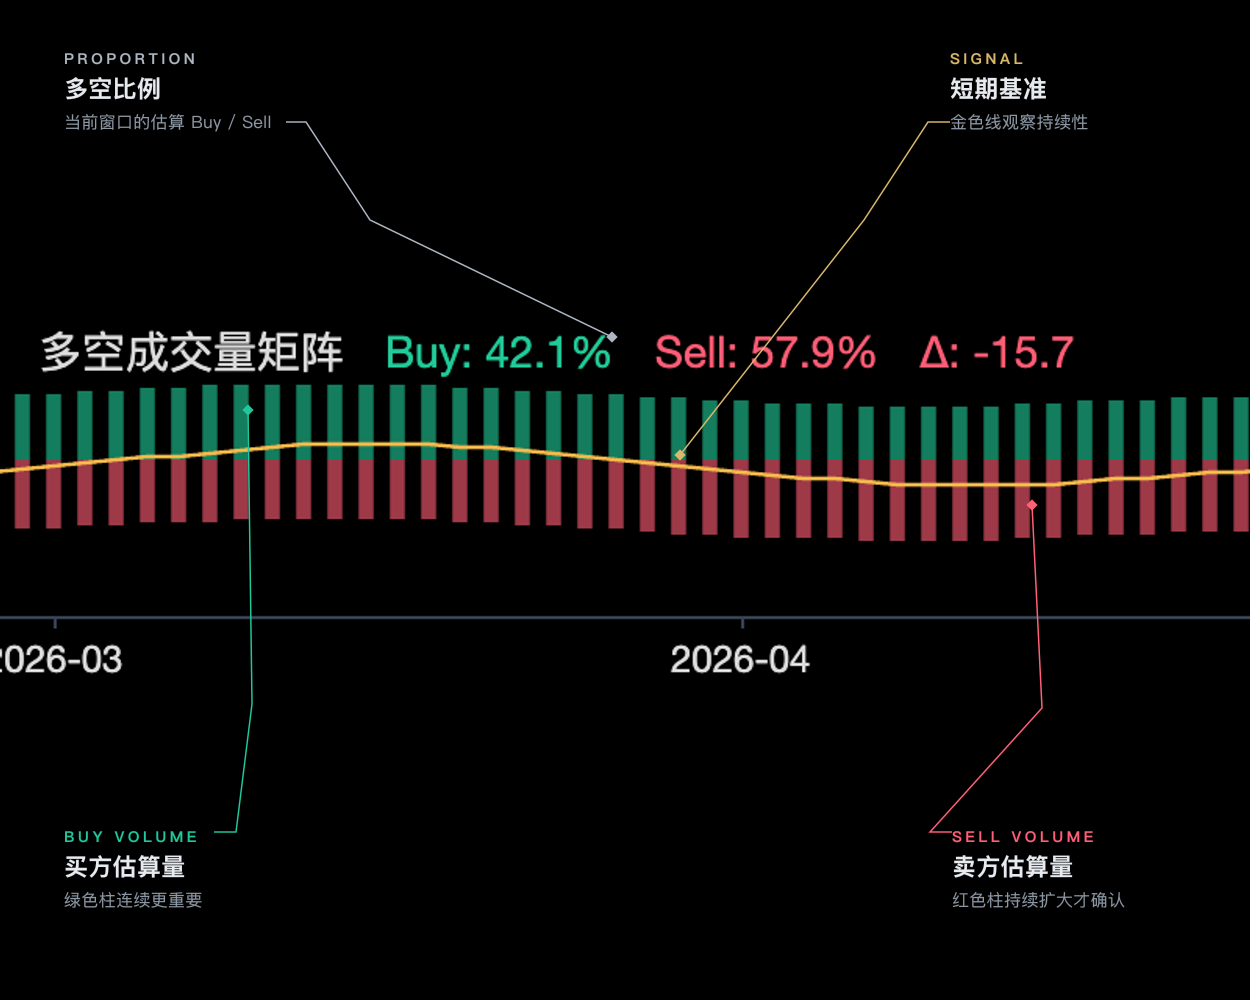
Use the matrix to see whether buyers or sellers are maintaining control across a move. Expanding green bars show stronger buyer control; expanding red bars show stronger seller control. The gold line helps reveal whether that advantage is continuing or fading.
It is useful for checking whether volume supports the price move. If price rises while the matrix weakens, the rally is losing confirmation. If price falls while selling pressure stops expanding, the decline may be tiring. This is not Level 2 data, so focus on persistent changes instead of one isolated spike.
How to read the chart
- Green bars
- Smoothed estimated buy volume exceeds sell volume
- Red bars
- Smoothed estimated sell volume exceeds buy volume
- Amber signal line
- Short-term baseline for persistence
- B / S percentages
- Latest smoothed estimated split
Signal confirmation
Buyer control
Delta expands above zero while money flow is also positive
Seller control
Delta expands below zero while money flow is also negative
Further viewing
Watch on YouTubeThis video is for feature guidance only. Use the output and parameters shown on this page as the source of truth.
How to use it
- 01
Judge control from persistent bars, not one isolated bar
- 02
Rising price with a weakening matrix lacks volume-structure confirmation
- 03
Agreement with Money Flow Tracker strengthens the state read
- 04
Stop using it when the pane reports that volume is unavailable
No-volume symbols, quote-volume-only markets, and isolated auction volume spikes.
Parameter guide
Longer is steadier; shorter reacts to single spikes
Tracks short-term changes in volume delta
Controls the B/S readout in the pane
For technical-analysis education only, not investment advice. Use independent judgment and risk controls.