Trend Assistant
Show one line that changes color and side as dynamic trend support or resistance.
Indicator overview
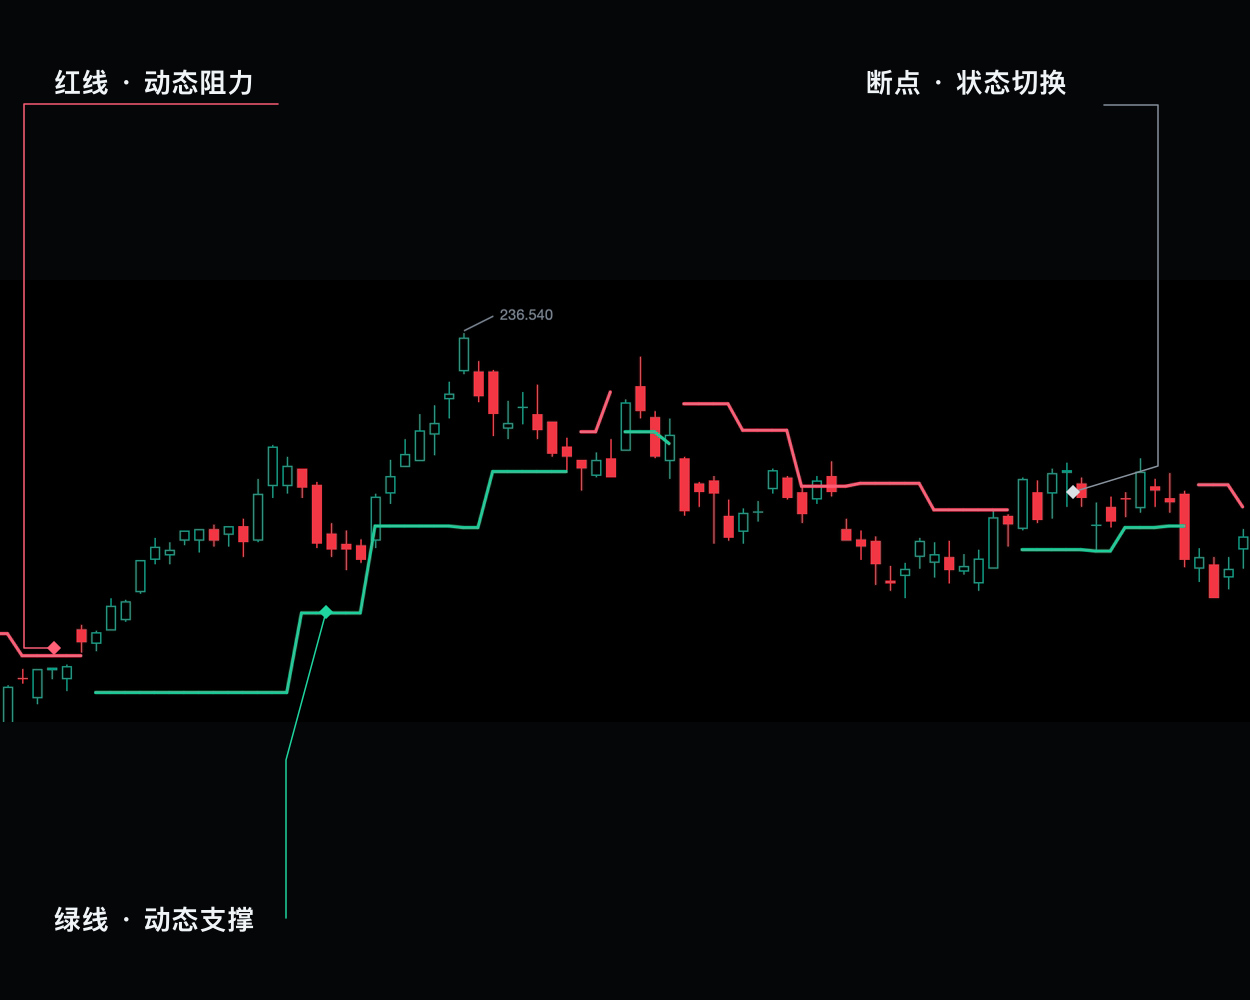
Use one line to read both trend direction and dynamic support or resistance. A green line below price favors a bullish view and helps locate pullback support. A red line above price favors a bearish view and helps locate rebound resistance.
It is useful for choosing a holding direction, finding second entries inside a trend, and trailing protection as price moves. A break in the line marks the end of the old state and the start of a new one; waiting for confirmation is usually better than chasing that transition.
How to read the chart
- Green line below price
- Bullish dynamic support and trailing-risk reference
- Red line above price
- Bearish dynamic resistance and trailing-risk reference
- Flip gap
- The old regime stops and the new line begins on the opposite side
Signal confirmation
Trend agreement
Kernel slope and step-channel state align
Structural mismatch
The two disagree, indicating transition or pullback
Further viewing
Watch on YouTubeThis video is for feature guidance only. Use the output and parameters shown on this page as the source of truth.
How to use it
- 01
Use the final state to choose long-only, short-only, or wait
- 02
A renewed turn after a trend pullback can mark a second-entry area
- 03
After a step update, wait if kernel and structure still disagree
- 04
Never treat a pivot plotted in hindsight as a signal available at that earlier bar
Ultra-fast entries and markets where repeated gaps distort pivot structure.
Parameter guide
Larger is smoother and slower; smaller hugs price
Shapes the decay of distant historical weights
Higher values retain only more prominent swings
Right-side bars; higher is steadier but later
For technical-analysis education only, not investment advice. Use independent judgment and risk controls.