Order Blocks
Anchor supply and demand to the structural origin of displacement and show the latest valid blocks with dynamic volume strength.
Indicator overview
Gold membership or above is required. Order Blocks are calculated on the server after minute reconciliation; replay follows its progress.
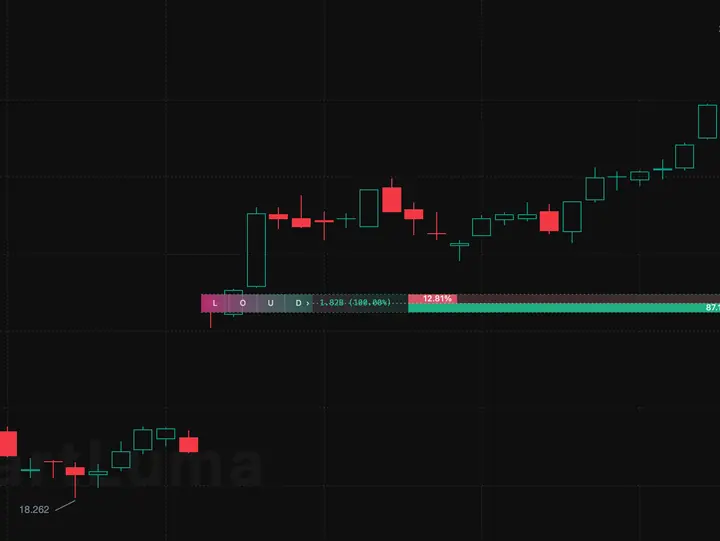
Use Order Blocks to mark supply and demand areas where price may react. Green zones can act as potential support and red zones as potential resistance. SOFT, HIGH, and LOUD separate weaker areas from stronger ones, so fresh HIGH or LOUD zones deserve attention first.
They help plan pullback entries, invalidation boundaries, and the next target rather than a single exact execution price. V6 runs on the current chart interval: a zone is confirmed on source+6, can trigger only on its first revisit, and then ends. The audited 83.78% win rate and +0.148R expectancy apply to the daily sample only; other intervals must be interpreted separately. Saved V4/V5 instances retain their own breaker and historical behavior. Panel volume is an OHLCV estimate, not real order flow.
How to read the chart
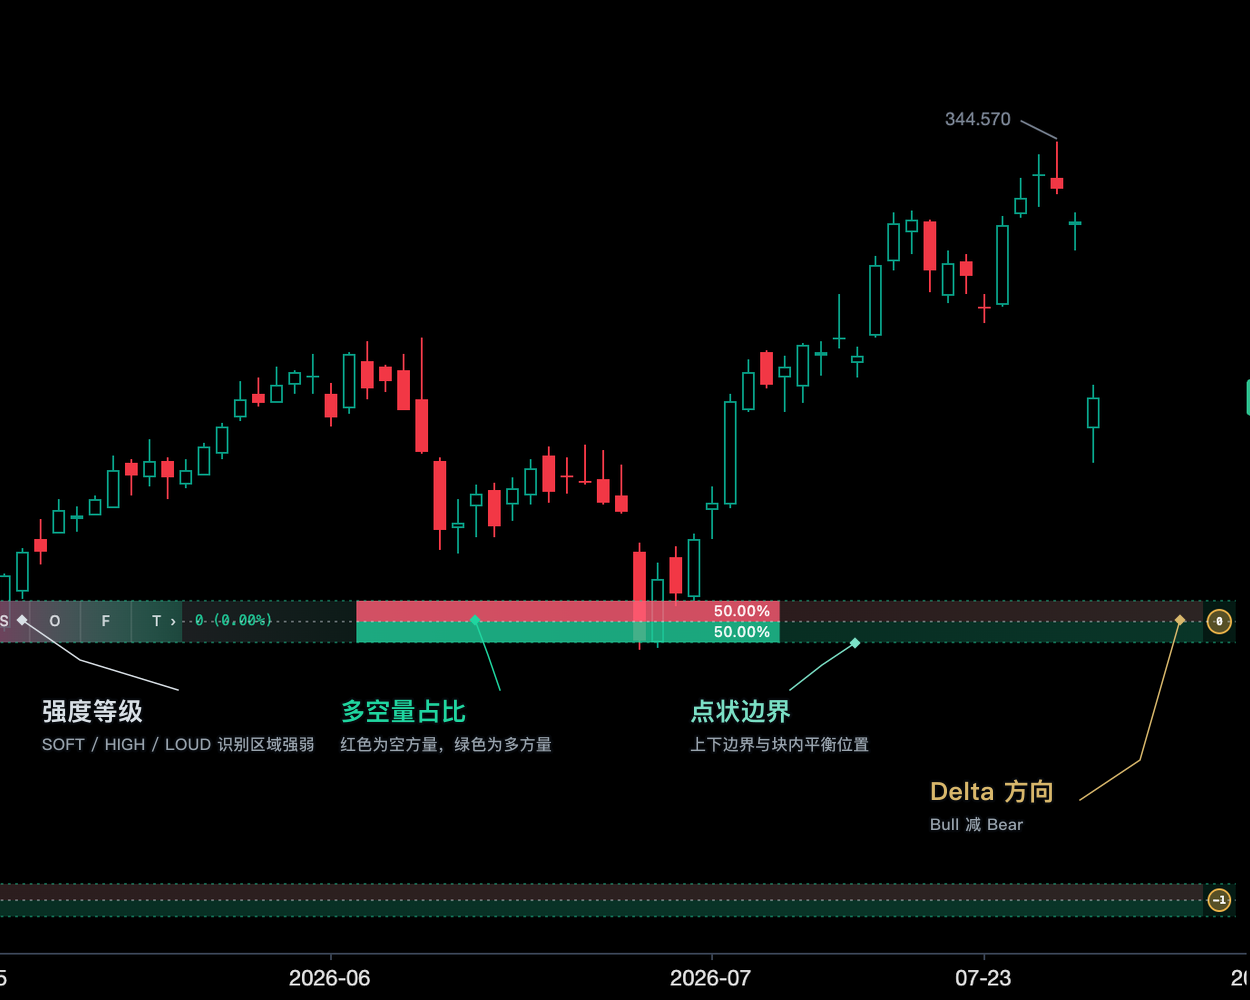
- SOFT / HIGH / LOUD cells
- Source-volume percentile over the latest 100 bars: SOFT below 45%, HIGH from 45%, and LOUD from 75%
- Source-candle volume
- Estimated source-candle volume plus its share across visible blocks
- Red / green volume bars
- Bearish volume above and bullish volume below; both sum to 100%
- Right-side Delta circle
- Blue is bullish, red bearish, amber neutral; the number is Bull minus Bear percent
- Bounds and midpoint
- Optional boundary lines plus the block equilibrium line
- Gray breaker zone
- V4/V5 only; V6 does not retain breakers
- V6 execution arrows
- Triangle plus V6 label at the first-revisit fill; off by default and toggled separately in settings
Signal confirmation
V6 block confirmed
The source forms a full-wick imbalance within two to five bars; source+6 remains at least 0.5 source ranges beyond the near edge and no first-six-bar wick crosses the far edge
First revisit
The first entry into the zone emits one touch signal; a gap beyond the far edge cancels it, with no repeat signals
Invalidation
The zone ends on first revisit, a close through the far edge, or age above 120 current-interval bars; V6 does not create breakers
Further viewing
Watch on YouTubeThis video is for feature guidance only. Use the output and parameters shown on this page as the source of truth.
How to use it
- 01
Frozen V6 trade protocol: execute the first near-edge revisit; use the open for a gap into the zone and cancel a gap beyond the far edge; stop 0.75 ATR beyond the far edge, target 0.4R, hold at most 24 current-interval bars, stop first on same-bar conflicts, and deduct 10 bps round trip
- 02
After review corrections, the locked 49-symbol set produced 9,850 visible causal trades using prior-bar ATR: 83.78% wins, +0.148R expectancy, and 2.35 average bars held. Matched random entries produced 70.99%, -0.029R, and 3.56 bars. The set had already been opened before this correction and is no longer described as a fresh blind test; historical results do not guarantee future performance
- 03
Trade only the first revisit. Do not reuse zones replaced by a 60%-overlapping newer zone, closed through the far edge, or older than 120 bars
- 04
SOFT/HIGH/LOUD and Bull/Bear remain OHLCV display estimates; they are not V6 admission gates or real order flow
- 05
Treat panel volume as source-candle context; absolute volume can differ by data provider, so compare rating and relative share first
- 06
Place risk beyond the invalidation structure with volatility room, not at an exact painted pixel
Missing volume, locked-limit sessions, gaps across the full zone, and very illiquid symbols.
Parameter guide
Matches the reference default and exposes more candidates; Attuned adds structural-break and regular-size filters
Optionally keep High-and-above or Loud-only blocks
New instances stay on V5. Any chart interval can opt into V6 with V91 source ranking, source+6 confirmation, and a one-shot first revisit; saved V5/V4 instances do not migrate
With 10 bps and prior-bar ATR, the 1m/3m/5m/15m/30m audits were negative expectancy and 1H was near zero. The published 83.78% and +0.148R apply only to daily data
Two-to-five-bar full-wick imbalance, 0.5-source-range retention, and no far-edge wick in the first six bars; not user-tunable
A V6 zone remains for at most 120 current-interval bars and ends immediately after its first revisit
Maximum number of the latest valid blocks kept on the chart, taken globally by recency rather than split between demand and supply
Use the full high-low range or candle body for block boundaries
Show both sides, demand only, or supply only
V6 never retains breakers; saved V4/V5 instances keep their prior contract
V6 confirms using bars 2 through 6 of the current interval, so wall-clock duration changes with timeframe
Six toggles control information density independently without changing block calculations; execution arrows are V6 only
For technical-analysis education only, not investment advice. Use independent judgment and risk controls.