Create account

Predict the trendFind buy & sell points

Buy and sell points, key levels — clear on one chart

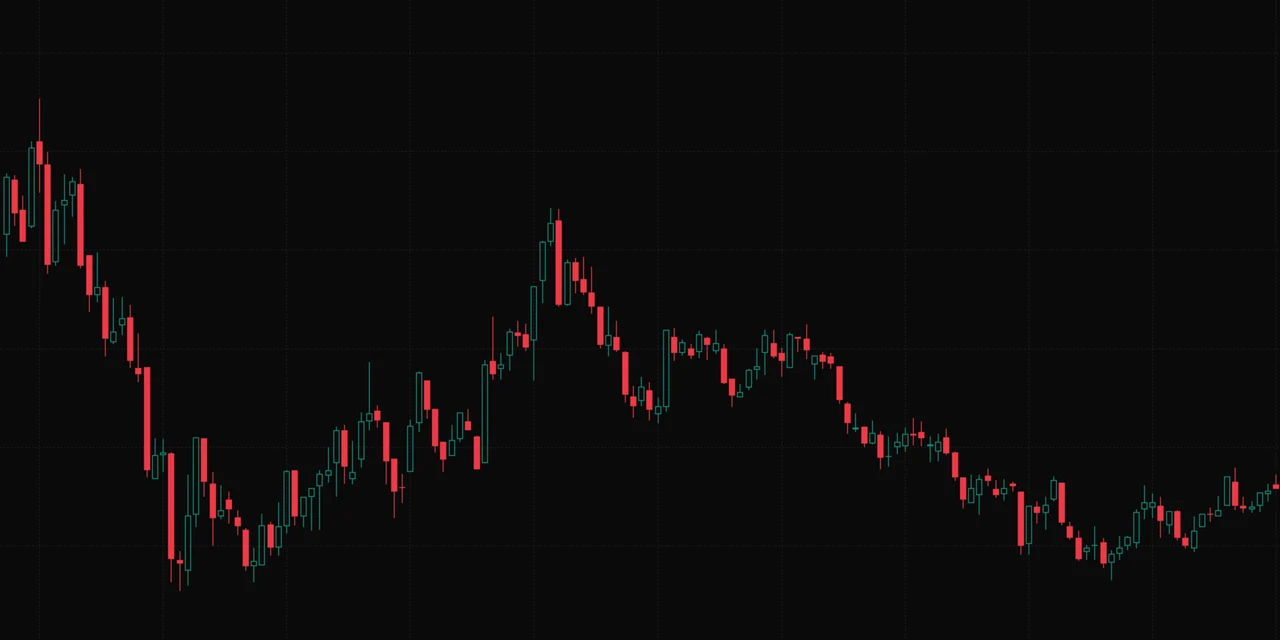
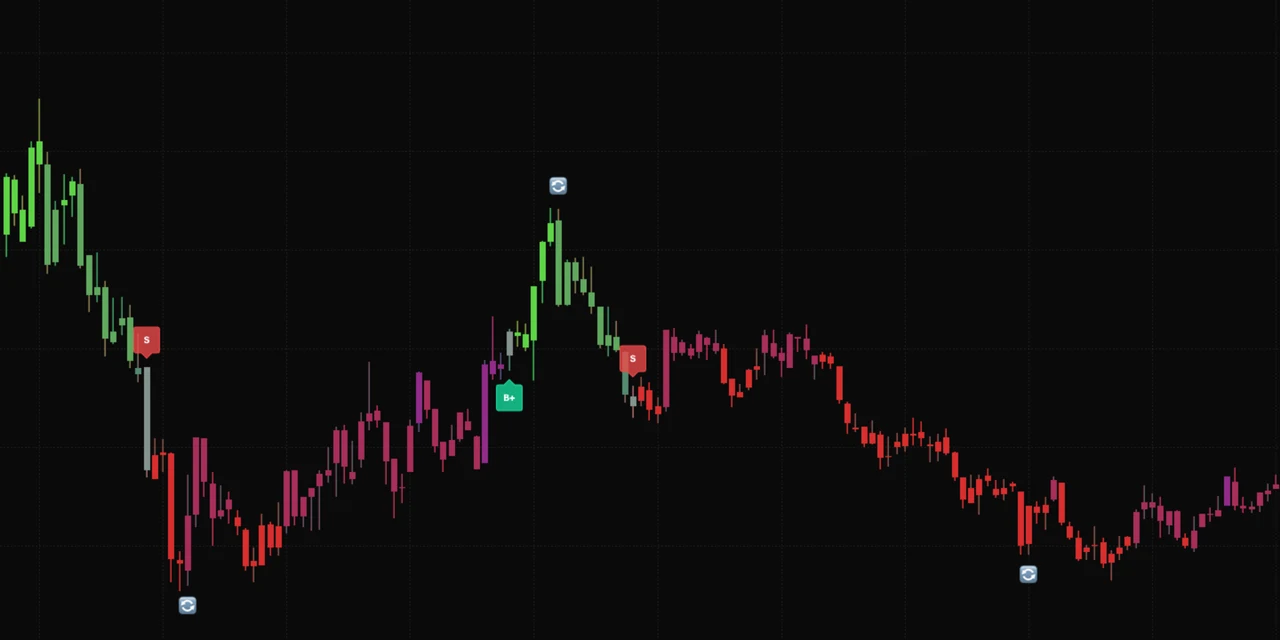
Trend Tracking output on a ChartLuma chart: trend-colored candles with B / S direction signals

Direction, signals, position

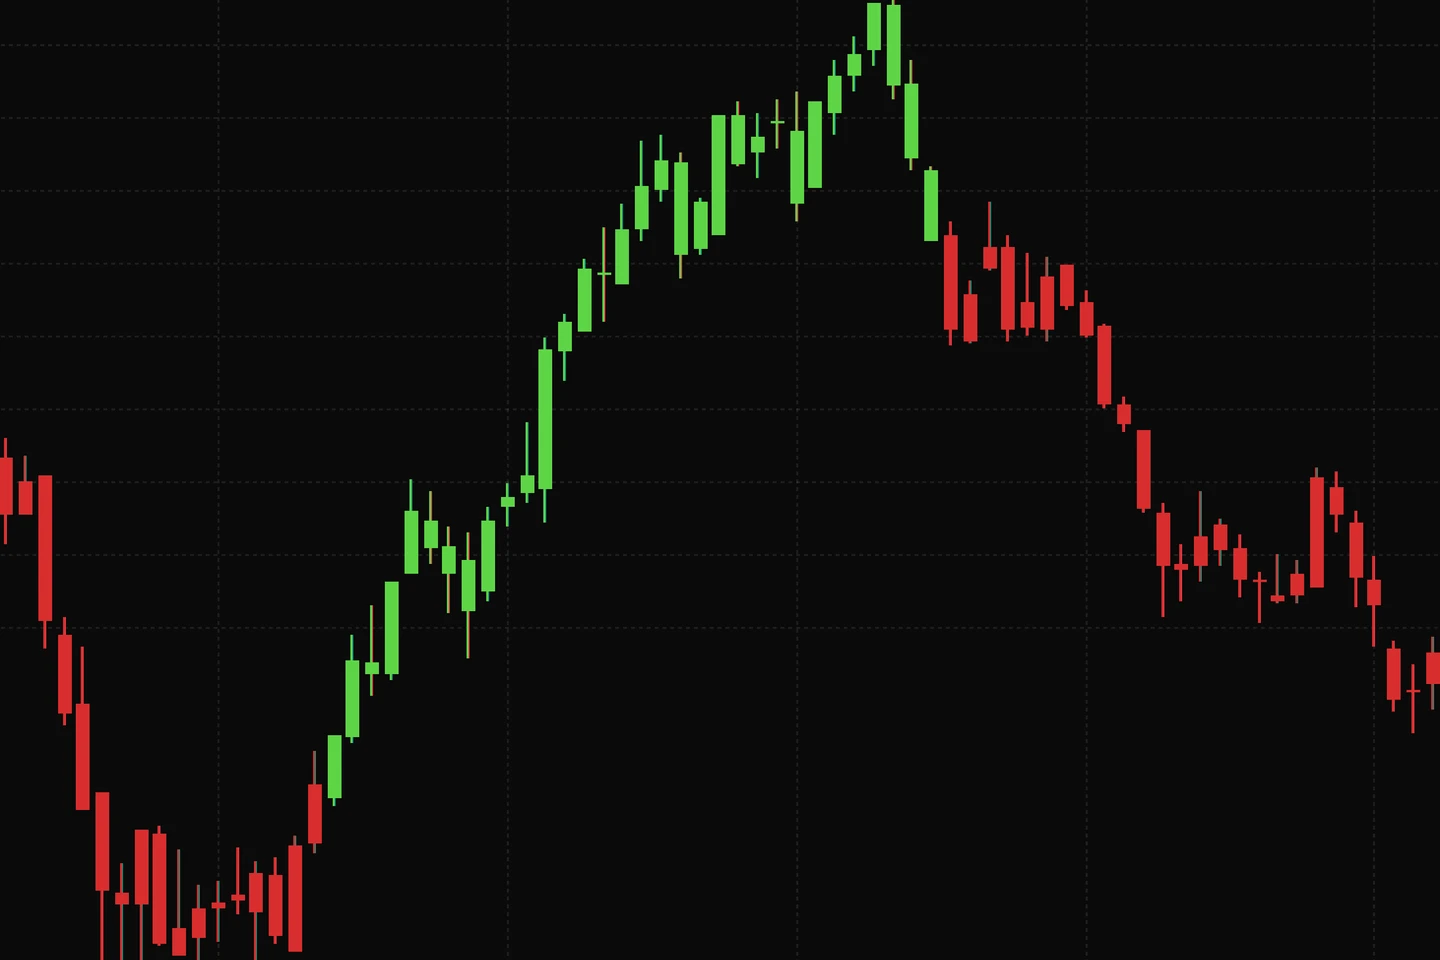
Detail of the same QQQ chart showing trend-colored candles

See trend strength at a glance

Seven candle colors, from strongly bullish to strongly bearish; the color reads the trend state, not the single bar — a green close can still be weak bullish; set your bias from the color first, then decide whether to follow or wait
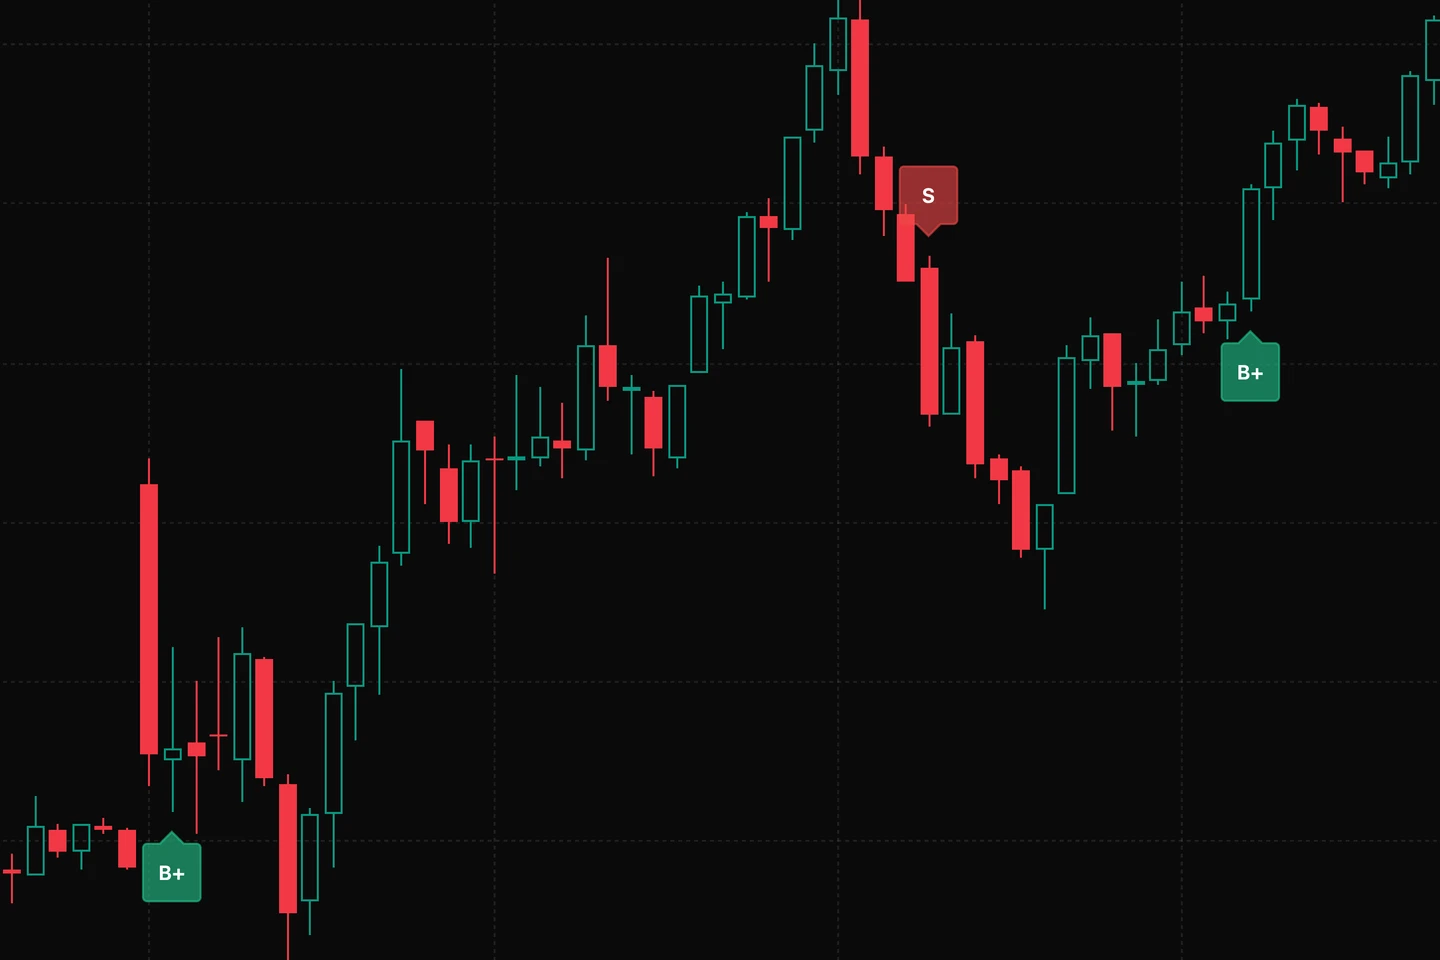
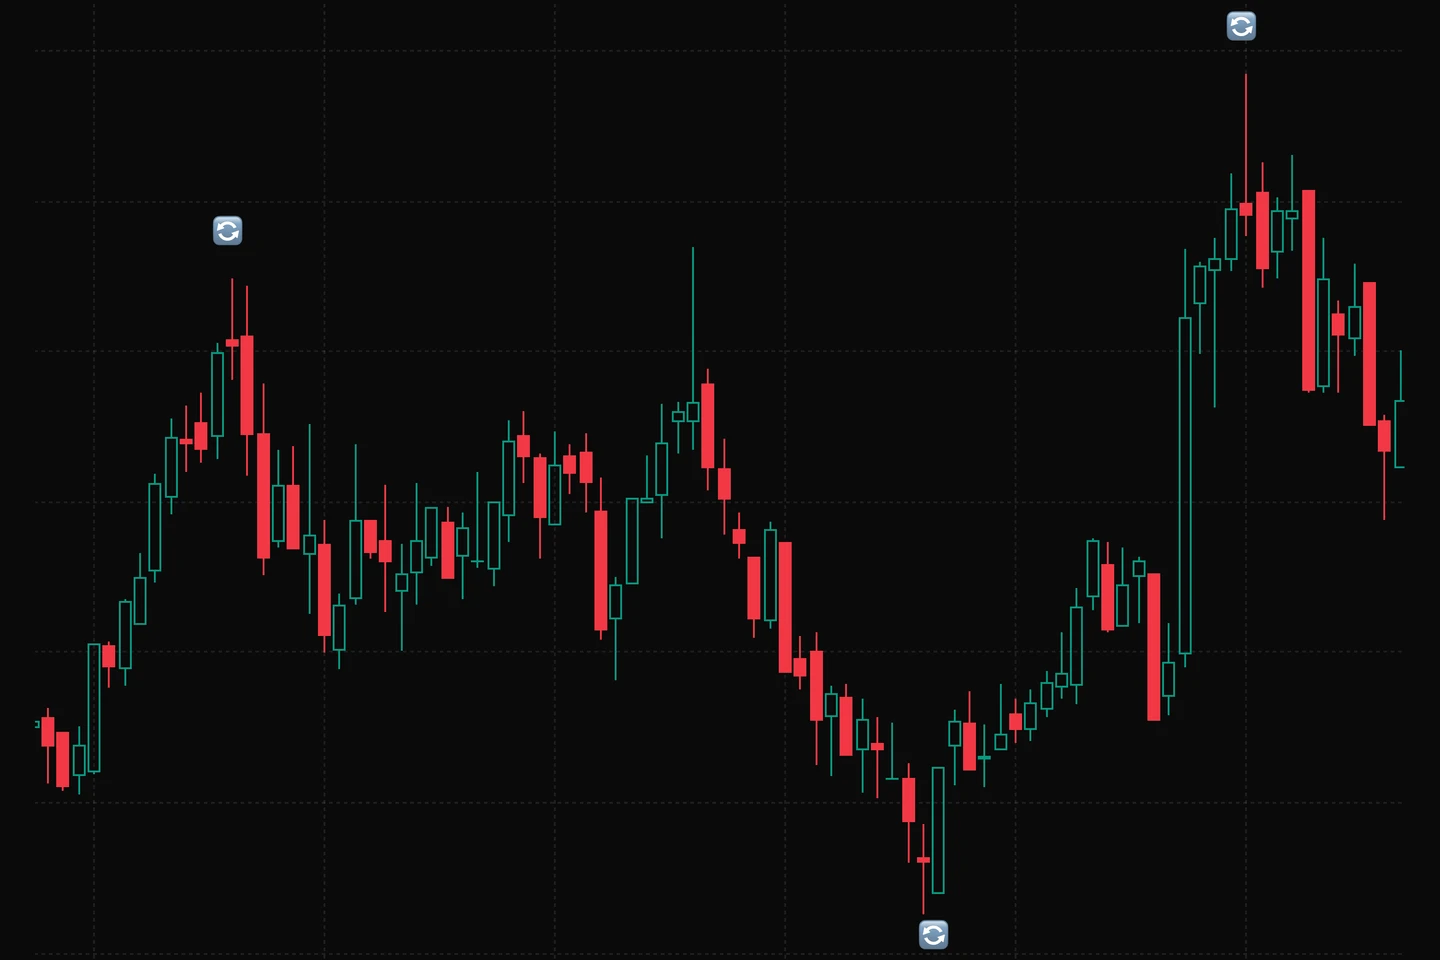
Detail of actual B/S direction signals on the QQQ historical chart

Catch direction changes

B / S mark a change in direction, and B+ / S+ mean more conditions line up so you can trade fewer, cleaner setups; solid labels are confirmed at the close, outlined ones only preview the current bar and can still change before it closes

Detail of the dynamic channel and price reference bands on the QQQ chart

Key levels, clearly visible

The dynamic channel leans bullish in green and bearish in red, and gray means direction is unclear so it is time to trade less; the upper and lower bands give reference levels, and the far side of the channel can serve directly as your stop

Start using Trend Tracking

The chart on this page shows indicator output on historical market data, for technical-analysis reference only. It is not investment advice. Markets carry risk — use your own judgment and manage position size.