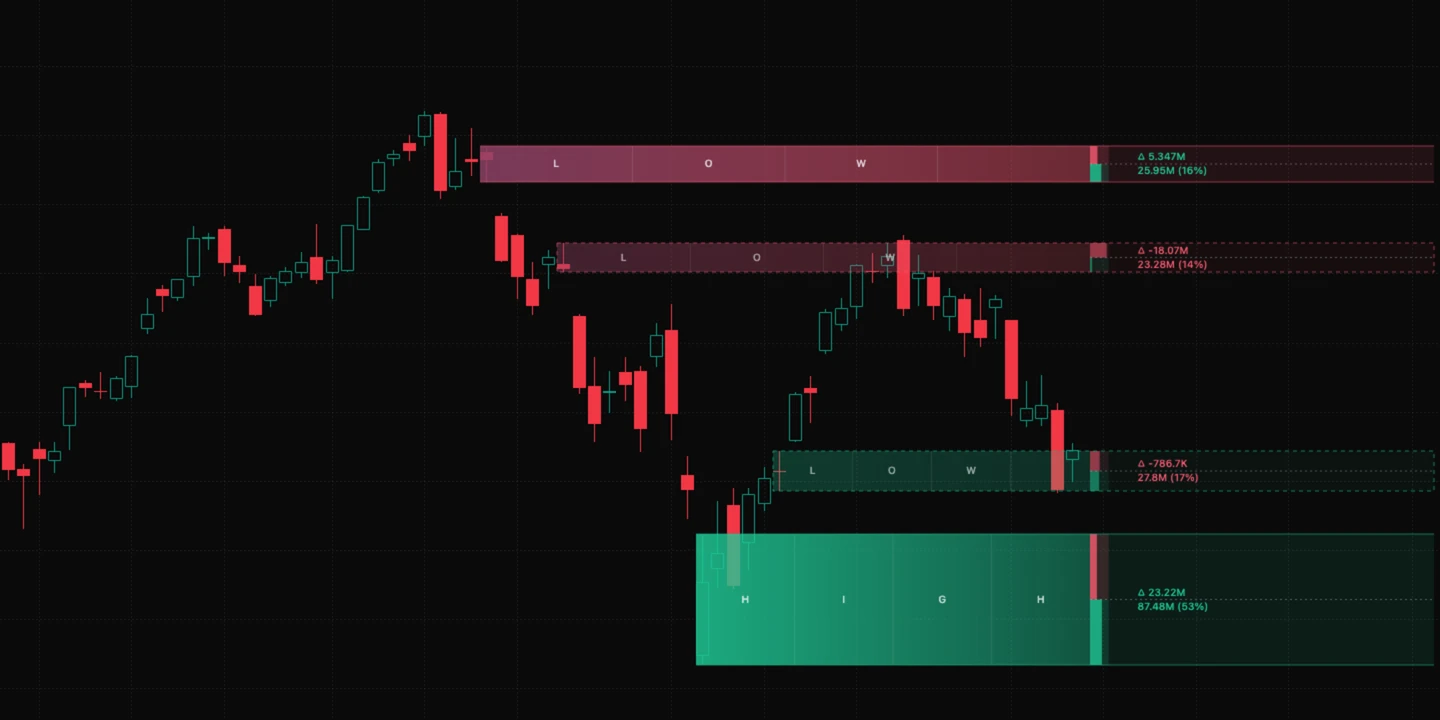
Supply and demand, drawn on the chart
Green demand zones are potential support and red supply zones potential resistance; each zone is a price range, not a single price you have to fill at
Support, resistance and retests — clear on one chart
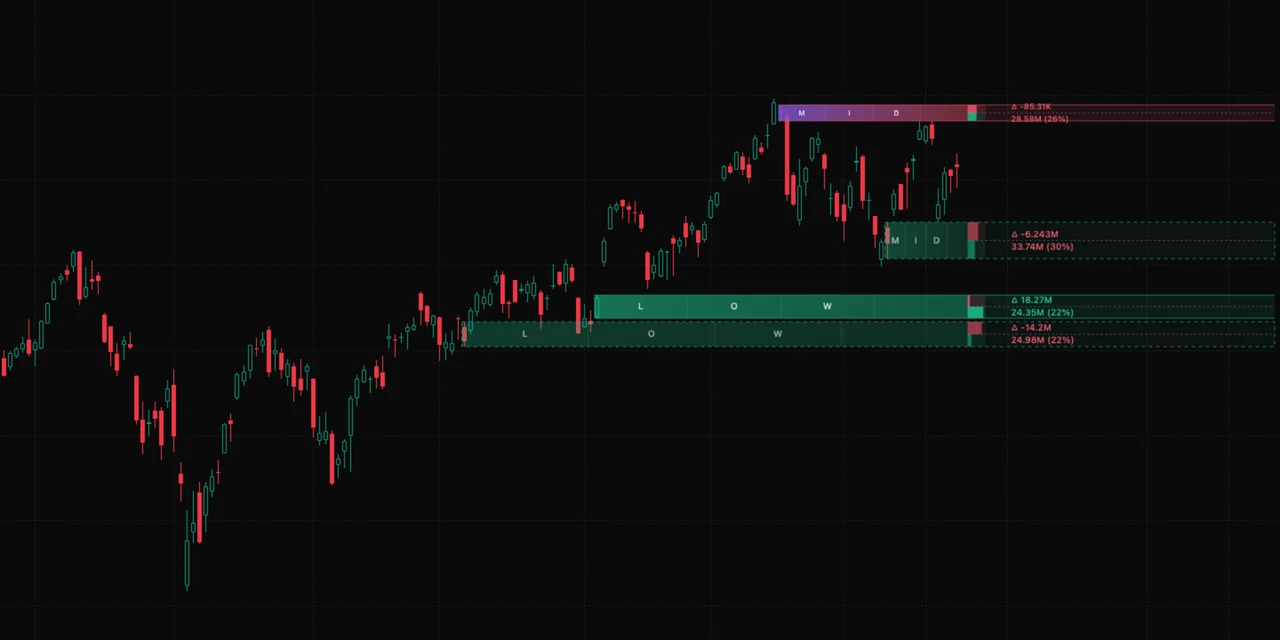
Green demand zones are potential support and red supply zones potential resistance; each zone is a price range, not a single price you have to fill at
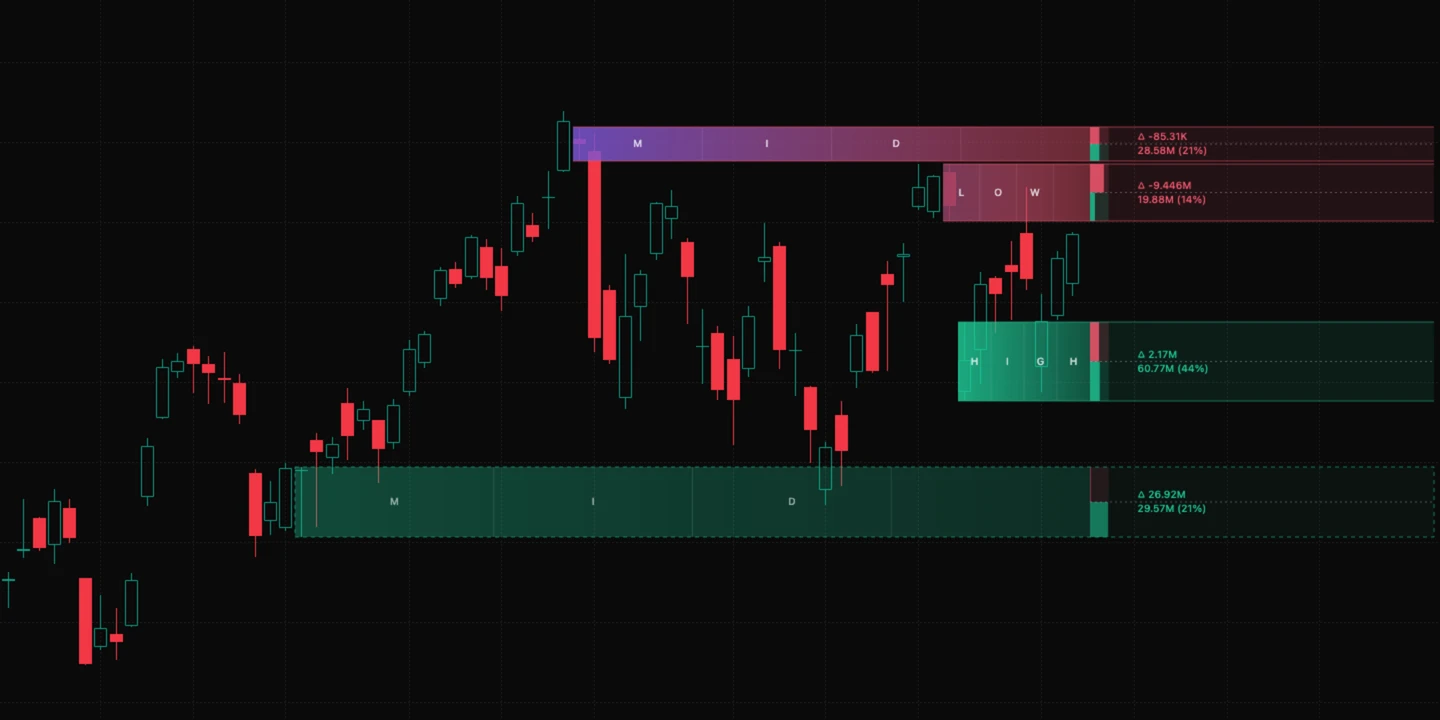
LOW, MID and HIGH show relative strength; combine the grade with price reactions and remember that displayed volume is an estimate
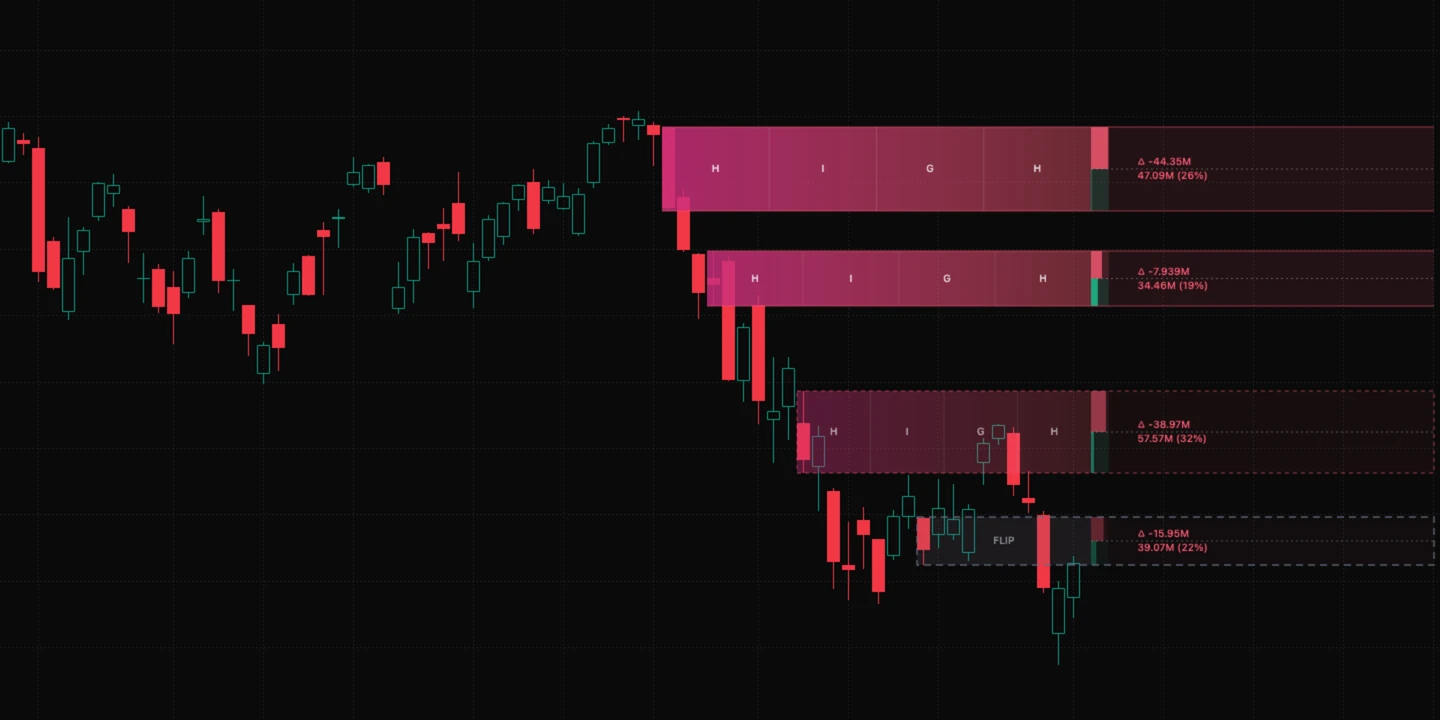
When price comes back, a zone that holds stays on the chart; a close through it marks the zone as FLIP, turning old support into resistance, with the remaining volume shown on the right