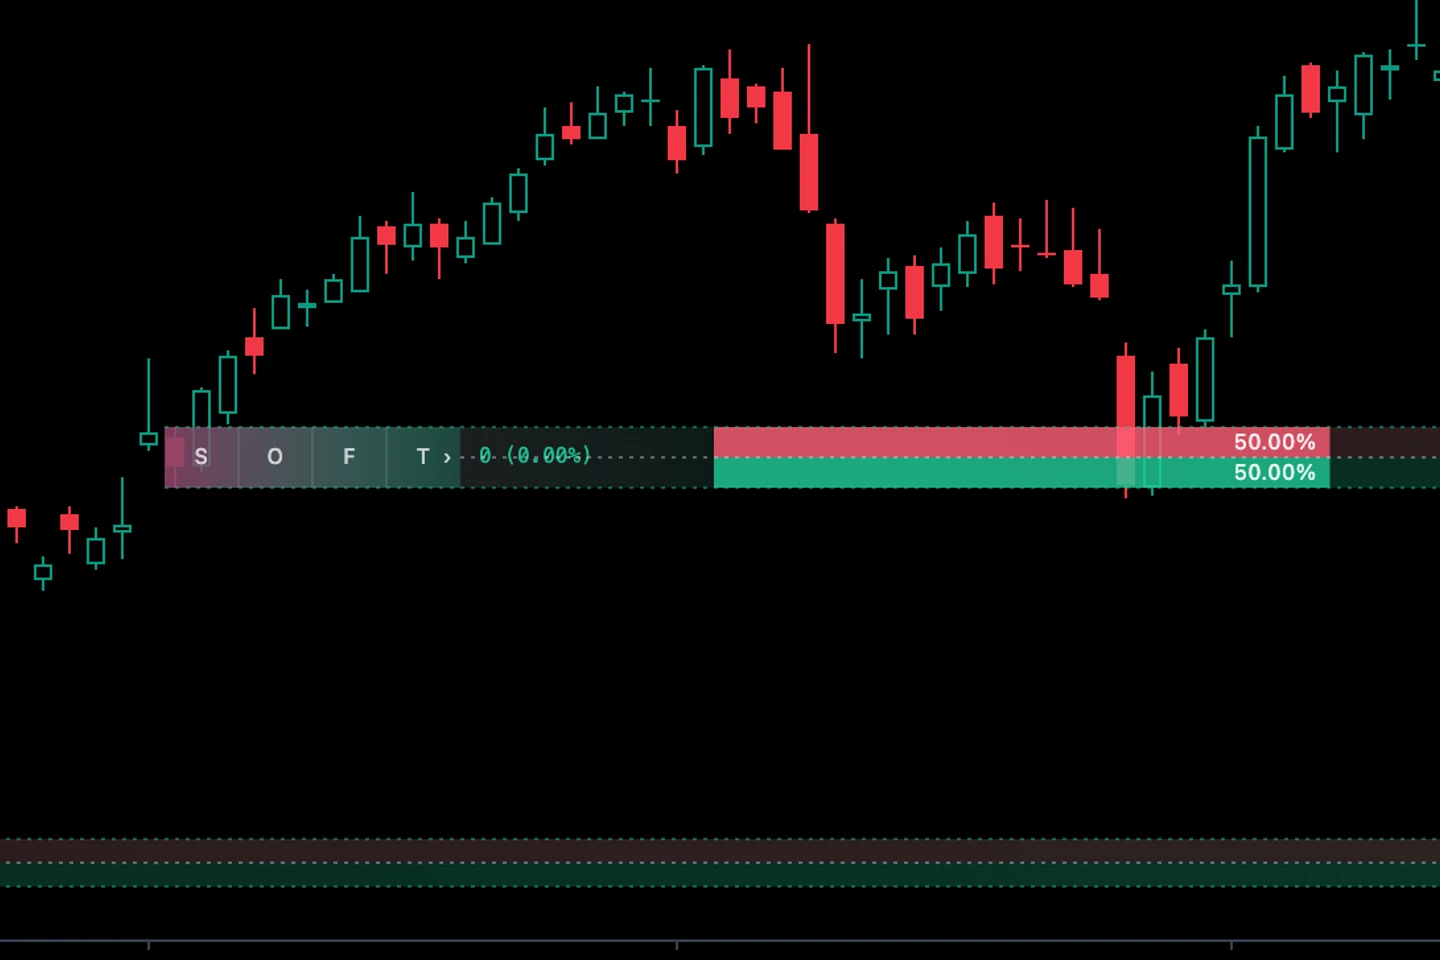
Supply and demand, drawn on the chart
Green demand zones are potential support and red supply zones potential resistance; each zone is a price range, not a single price you have to fill at
Support, resistance and retests — clear on one chart
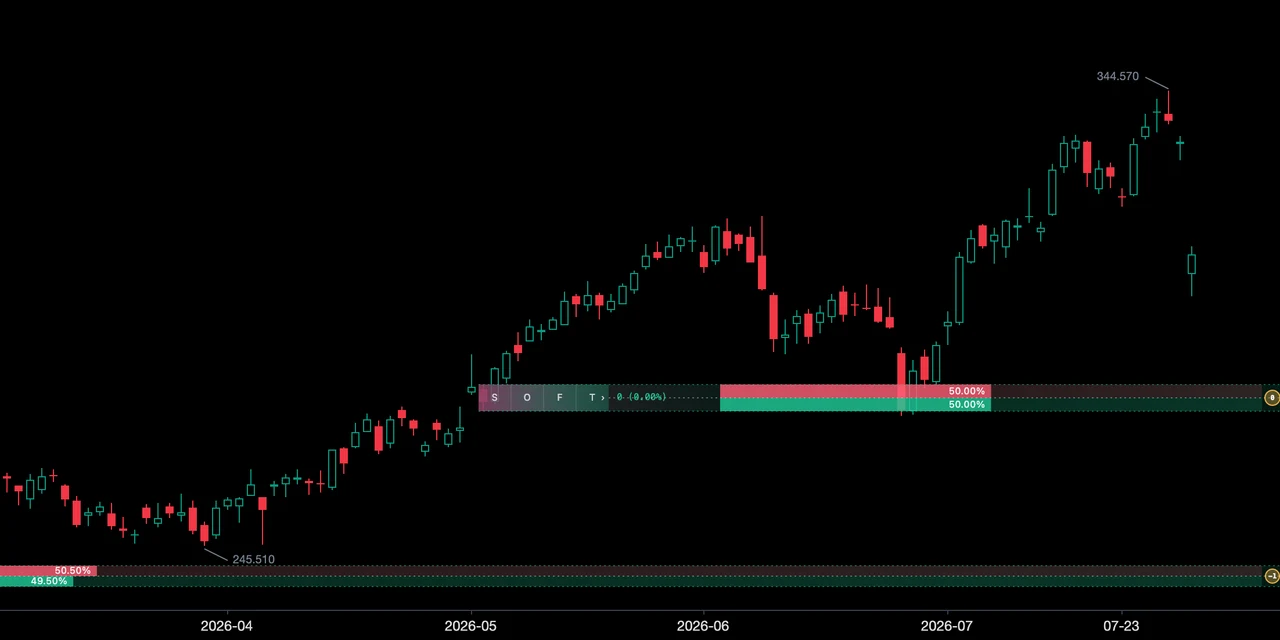
Green demand zones are potential support and red supply zones potential resistance; each zone is a price range, not a single price you have to fill at
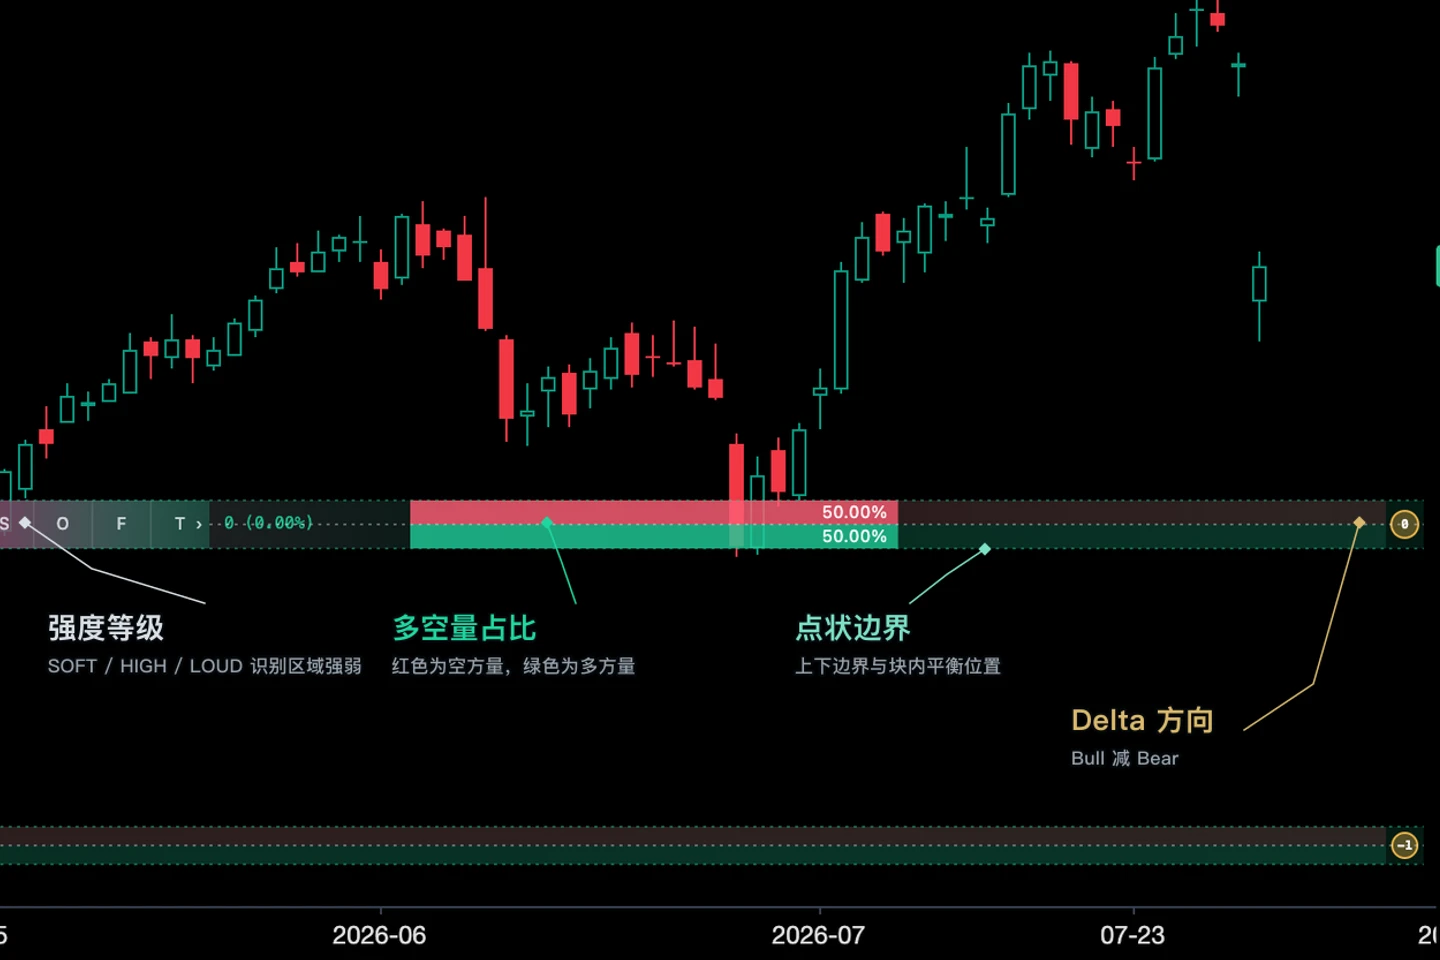
SOFT, HIGH and LOUD grade each zone by the volume of its source candle, so focus on fresh, stronger zones; volume is an estimate, not real order flow
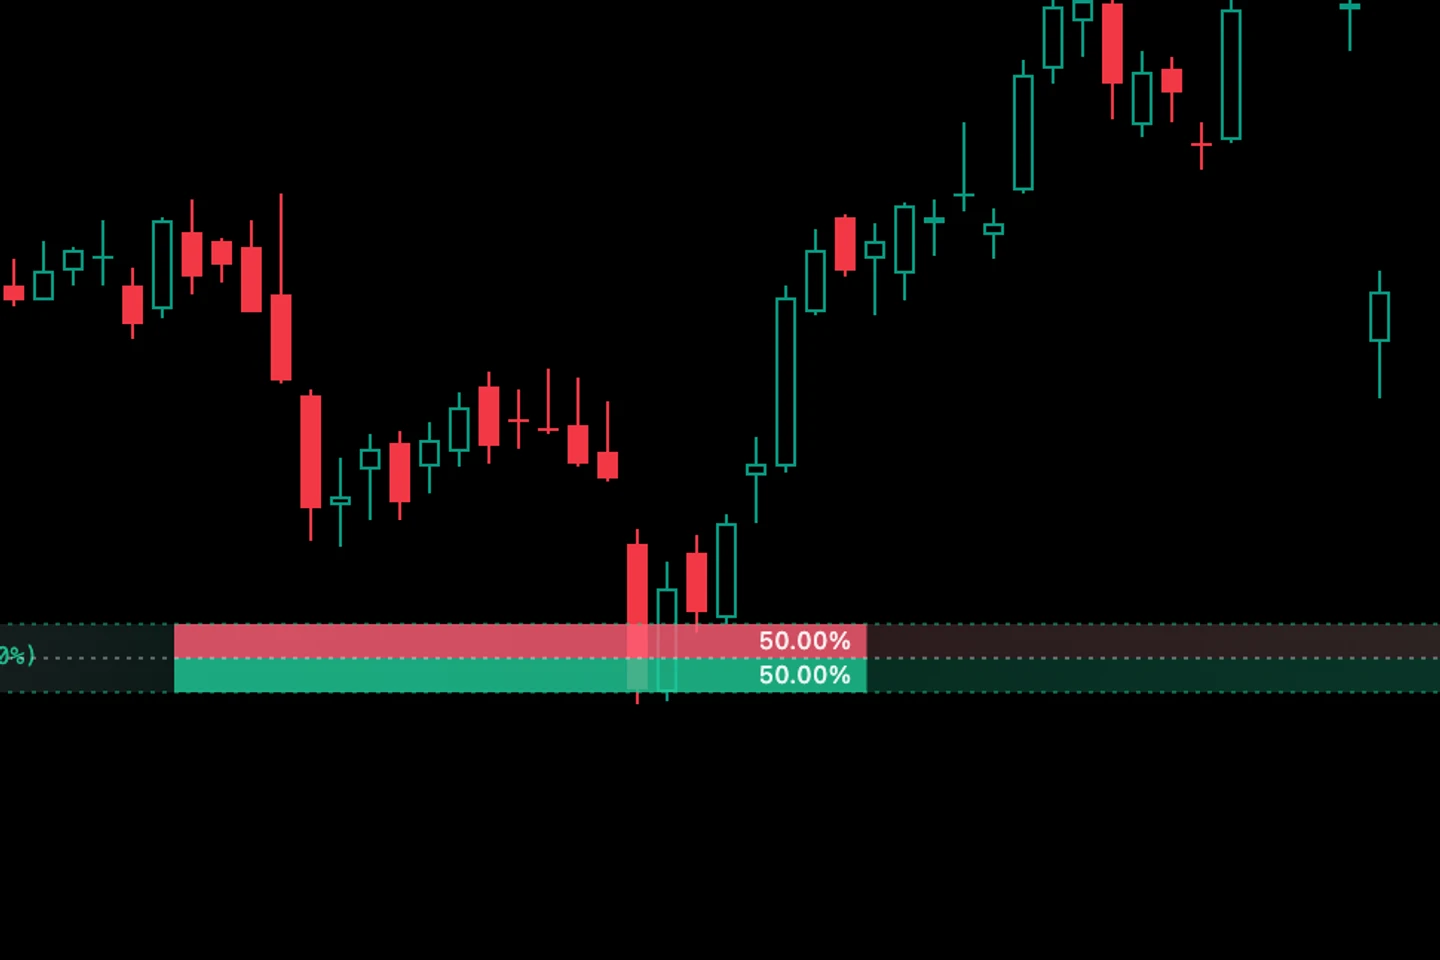
With V6 selected, the first time price returns to a zone you get one prompt; a gap past the far edge cancels it, and zones expire once broken or left too long